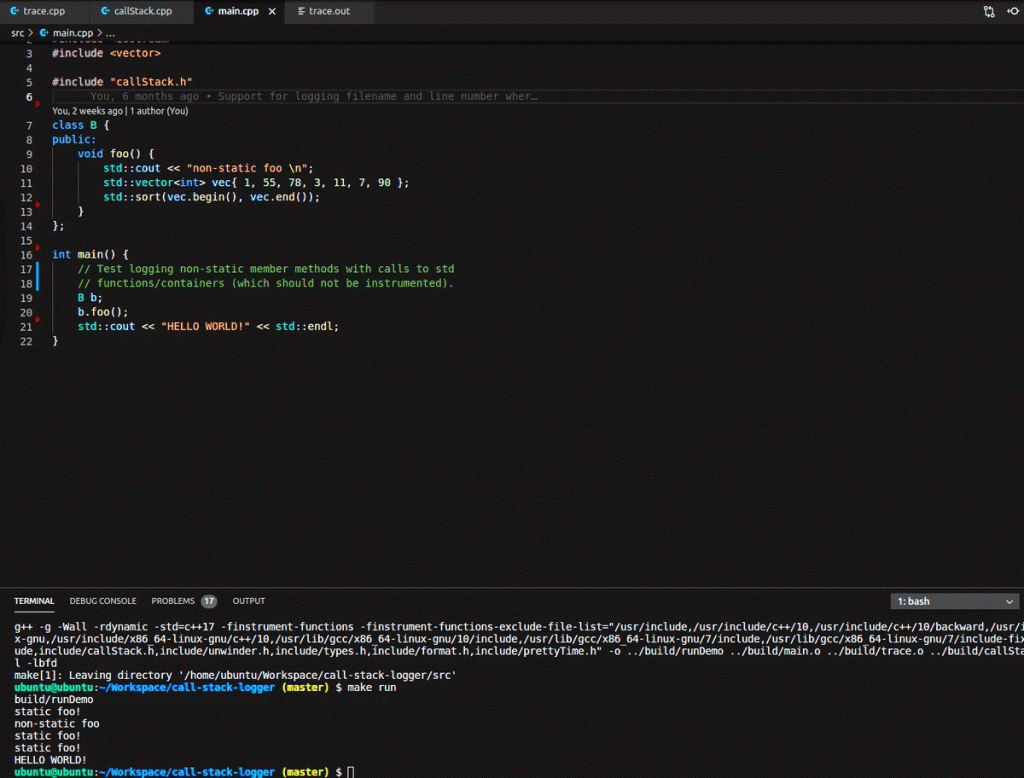
Have you ever worked on the C++ project with codebase so huge that it is hard to understand what’s really going on when the program executes? Which functions are called from what place? Have you ever been assigned to solve a bug in such a project, being given the logs which by no means bring you any closer to find the root cause of the problem? And the following reproductions fail to provide you with any useful information? If the answer is yes – please bear with me.
Seeking the solution
I started mulling over what traits of the tool could help me better understand the nature of the problems and bugs that arise. Someone here could ask – “Isn’t it what debuggers were invented for?”. Of course – debuggers are a huge help providing that you have an access to the environment on which you can freely run the faulty code and debug it line by line which, to my experience, is not always so evident. In many cases the problem is reproducible only on customer’s infrastructure and they won’t allow you to experiment on a living organism. Or you lack the necessary test setup. Or the source of the problem lies in a third-party library and you don’t have access to its source code. Or the problem is simply too complex to debug it traditionally. Whatever the reason is, the alternative approach may be inevitable. I decided to impose the following constraints on the tool that could satisfy my needs:
- every time the user-defined function is being called, it should be logged to the file;
- functions are demangled and presented in logs in a user-friendly way;
- logging should be performed out of the box – without the need for a developer to pollute the code with some extra macros at the beginning of every function;
- functions from standard library should be excluded from logging – we want to avoid the situation when we print hundreds of lines when performing simple operations on the containers;
- log the filename and line number from where given function is called;
- each function nesting adds an ident, whereas returning from a function removes it – as a result call stack tree is produced at the runtime giving the visual understanding which function calls which;
- the logging mechanism may be activated only if compiled under some debug flag – this way we will avoid expensive overhead during normal program’s execution;
- Linux based.
As painstakingly as I browsed the web, I could only find the solutions that met just the single points of my requirements, none of them had them all, so I decided to write my own micro-framework and call it Call Stack Logger.
Starting point
Firstly, we will have to start from the mechanism that will allow us to invoke certain functions every time we enter or exit any function. This may sound a little similar to Aspect-oriented programming but the difference here is that on-enter and on-exit functions have the signatures already defined by the compiler. I’m talking here about gcc feature called function instrumentation. In order to activate it, we have to pass the following compilation flag to gcc:
-finstrument-functions
Now we are free to define the profiling functions in whatever place suitable for us. I just created trace.cpp file and put them there:
extern "C" __attribute__((no_instrument_function))
void __cyg_profile_func_enter(void *callee, void *caller) {
// Code to be executed just after function entry.
}

extern "C" __attribute__((no_instrument_function))
void __cyg_profile_func_exit(void *callee, void *caller) {
// Code to be executed just before function exit.
}
Both functions have two void pointers as the arguments – callee is a pointer to the function that is currently being called, whereas caller is a call site which points to the location (line of code) from where the function is called. The __attribute__((no_instrument_function)) in the function signature is responsible for excluding the given function from instrumentation. In other words – we don’t want profiling functions to be instrumented to avoid infinite calls leading to seg faults. To make it look a little more friendly, we can define a macro:
#ifndef NO_INSTRUMENT
#define NO_INSTRUMENT __attribute__((no_instrument_function))
#endif
As the next thing, we will add a simple logging mechanism to save the history of the functions that are being called.
#include <stdio.h>

static FILE *fp_trace;

__attribute__ ((constructor))
NO_INSTRUMENT
void trace_begin() {
fp_trace = fopen("trace.out", "a");
}

__attribute__ ((destructor))
NO_INSTRUMENT
void trace_end() {
if(fp_trace != nullptr) {
fclose(fp_trace);
}
}
After we have our file pointer initialized we can use it inside __cyg_profile_func_enter function. Let’s just log there the address of the function being called:
if(fp_trace != nullptr) {
fprintf(fp_trace, "enter %p\n", callee);
}
And some basic example:
#include <iostream>
#include <vector>
#include <algorithm>

class A {
public:
static void foo() {
std::cout << "static foo \n";
std::vector<int> vec { 1, 55, 78, 3, 11, 7, 90 };
std::sort(vec.begin(), vec.end());
}
};

int main() {
// Test logging static member methods.
A::foo();
return 0;
}
The trace.out file will contain the following:
enter 0x5602d9622be5
enter 0x5602d9622f1c
enter 0x5602d9623084
enter 0x5602d96233b2
enter 0x5602d96230fc
enter 0x5602d962342a
enter 0x5602d96239b6
enter 0x5602d9623fa6
…
…
…
Decoding the addresses
From the output above we are not able to obtain much information as we get only the address of the function that is being called which is not very useful in terms of debugging. Apart from that we can notice a lot of entries in the log file (actually I got 232 lines of those) instead of only 2 – for main and A::foo(). Why is that? To figure it out we will have to decode those addresses. For that purpose we will need binutils as a prerequisite:
$ sudo apt install binutils-dev
Also we need to add another gcc option in order to have dynamic symbol information in the executable:
-rdynamic
And link against those two:
-ldl -lbfd
libdl is a Dynamic Link Library which is an interface to the dynamic loader and allows us, among others, to look up the symbols, libbfd is Binary File Descriptor library which is used to operate on object files and will be used later.
Let’s firstly do a simple decoding. Include the headers:
#include <dlfcn.h> // for dladdr
#include <cxxabi.h> // for __cxa_demangle
and in __cyg_profile_func_enter define now the following body instead of previous naive logging of the function address:
if (fp_trace != nullptr) {
Dl_info info;
if (dladdr(func, &info)) {
int status;
const char* name;
char* demangled = abi::__cxa_demangle(info.dli_sname, nullptr, 0, &status);
if (status == 0) {
name = demangled ? demangled : "[not demangled]";
} else {
name = info.dli_sname ? info.dli_sname : "[no dli_sname]";
}
fprintf(fp_trace, "%s (%s)\n", name, info.dli_fname);
if (demangled) {
delete demangled;
demangled = nullptr;
}
} else {
fprintf(fp_trace, "%s\n", "unknown");
}
}
After compiling and running the program you’ll see now the following in trace.out file:
main (build/runDemo)
A::foo() (build/runDemo)
std::allocator::allocator() (build/runDemo)
__gnu_cxx::new_allocator::new_allocator() (build/runDemo)
std::vector<int, std::allocator >::vector(std::initializer_list, std::allocator const&) (build/runDemo)
std::_Vector_base<int, std::allocator >::_Vector_base(std::allocator const&) (build/runDemo)
std::_Vector_base<int, std::allocator >::_Vector_impl::_Vector_impl(std::allocator const&) (build/runDemo)
std::allocator::allocator(std::allocator const&) (build/runDemo)
__gnu_cxx::new_allocator::new_allocator(__gnu_cxx::new_allocator const&) (build/runDemo)
std::_Vector_base<int, std::allocator >::_Vector_impl_data::_Vector_impl_data() (build/runDemo)
std::initializer_list::end() const (build/runDemo)
std::initializer_list::begin() const (build/runDemo)
std::initializer_list::size() const (build/runDemo)
std::initializer_list::begin() const (build/runDemo)
void std::vector<int, std::allocator >::_M_range_initialize(int const*, int const*, std::forward_iterator_tag) (build/runDemo)
std::iterator_traits::difference_type std::distance(int const*, int const*) (build/runDemo)
…
…
…
And again in total 232 lines of decoded functions. All those functions come from a standard library and are linked to all of the operations that are invoked during the creation, memory allocation, initialization, sorting and destruction of the vector that we used in our example. We only wrote and called a 3-line function and got such a huge output in return. That’s definitely too much clutter, we have to do something with it because it totally obfuscates our log file. Besides, in most cases we are not interested in details of what standard functions do, as we trust they do exactly what their names suggest. We want to focus on a business logic that our user-defined functions introduce and confine logging mechanism only to them.
Exclude standard library from instrumentation
Happily, gcc provides us with a special instrumentation option:
-finstrument-functions-exclude-file-list
in which we can list the locations of all the headers from C++ standard that we’d like to exclude from instrumentation, like /usr/include, /usr/include/c++, /usr/include/x86_64-linux-gnu/c++/10, etc.
Unfortunately those paths may differ depending on Linux OS or gcc version, so to make it easier I wrote the piece of shell script inside Makefile to automatically find and list all of the locations of C++ standard library headers and pass them to -finstrument-functions-exclude-file-list:
# Find C++ Standard Library header files to exclude them from instrumentation
CPP_STD_INCLUDES=$(shell ( `gcc -print-prog-name=cc1plus` -v < /dev/null 2>&1 \
| LC_ALL=C sed -ne '/starts here/,/End of/p' \
| grep -o '/[^"]*' ; \
`gcc -print-prog-name=cpp` -v < /dev/null 2>&1 \
| LC_ALL=C sed -ne '/starts here/,/End of/p' \
| grep -o '/[^"]*' ) \
| cat | sort | uniq | tr '\n' ',' | sed 's/\(.*\),/\1 /' | xargs )

# Exclude tracing functions themselves from instrumentation
CPP_STD_INCLUDES := "${CPP_STD_INCLUDES},include/callStack.h"

CXXFLAGS = -g -Wall -rdynamic -std=c++17 -finstrument-functions -finstrument-functions-exclude-file-list=$(CPP_STD_INCLUDES)
After doing so, recompiling and rerunning the program, we will get the following output:
main (build/runDemo)
A::foo() (build/runDemo)
which is much closer to what we want to achieve.
Improving the solution
Now we will modify the current solution to introduce further enhancements. Instead of printing binary name we will print the filename and line number from where the function was called as it seems to be much more meaningful information during problem solving. We can also add a timestamp when a particular function is being called. Here is the code responsible for the core mechanism of Call Stack Logger:
#include "callStack.h"
#include "prettyTime.h"
#include "unwinder.h"
#include <bfd.h>
#include <cxxabi.h> // for __cxa_demangle
#include <dlfcn.h> // for dladdr
#include <fstream>
#include <map>
#include <memory>
#include <stdexcept>
#include <unistd.h>

namespace {

NO_INSTRUMENT
std::string demangle_cxa(const std::string& _cxa) {
int status;
std::unique_ptr<char, void (*)(void*)> realname(
abi::__cxa_demangle(_cxa.data(), nullptr, nullptr, &status), &free);
if (status != 0) {
return _cxa;
}

return realname ? std::string(realname.get()) : "";
}

} // namespace

namespace instrumentation {

struct ResolvedFrame {
std::string timestamp;
std::optional<void*> callee_address;
std::string callee_function_name;
std::string caller_filename;
std::optional<unsigned int> caller_line_number;
};

std::optional<ResolvedFrame> resolve(void* callee_address, void* caller_address) {
return bfdResolver::resolve(callee_address, caller_address);
}

std::optional<ResolvedFrame> bfdResolver::resolve(void* callee_address, void* caller_address) {
check_bfd_initialized();

auto maybe_func_name = resolve_function_name(callee_address);
if (!maybe_func_name) {
return std::nullopt;
}
ResolvedFrame resolved;
resolved.callee_function_name = *maybe_func_name;

// If the code is not changed 6th frame is constant as the execution flow
// starting from 6th frame to the top of the stack will look e.g. as follows:
// * 6th - instrumentation::FrameUnwinder::unwind_nth_frame
// * 5th - bfdResolver::resolve instrumentation::unwind_nth_frame
// * 4th - instrumentation::bfdResolver::resolve
// * 3rd - instrumentation::resolve
// * 2nd - __cyg_profile_func_enter
// * 1st - A::foo() --> function we are interested in
//
// Otherwise, if this call flow is altered, frame number must be recalculated.
Callback callback(caller_address);
unwind_nth_frame(callback, 6);

auto pair = resolve_filename_and_line(callback.caller);
resolved.caller_filename = pair.first;
resolved.caller_line_number = pair.second;
resolved.timestamp = utils::pretty_time();

return std::make_optional(resolved);
}

std::optional<std::string> bfdResolver::resolve_function_name(void* address) {
Dl_info info;
dladdr(address, &info);
if (info.dli_fbase == nullptr) {
return "<address to object not found>";
}

if (!ensure_bfd_loaded(info) || s_bfds.find(info.dli_fbase) == s_bfds.end()) {
return "<could not open object file>";
}
storedBfd& currBfd = s_bfds.at(info.dli_fbase);

asection* section = currBfd.abfd->sections;
const bool relative = section->vma < static_cast<uintptr_t>(currBfd.offset);

while (section != nullptr) {
const intptr_t offset = reinterpret_cast<intptr_t>(address) - (relative ? currBfd.offset :              0) - static_cast<intptr_t>(section->vma);

if (offset < 0 || static_cast<size_t>(offset) > section->size) {
section = section->next;
continue;
}

const char* file;
const char* func;
unsigned line;
if (bfd_find_nearest_line(currBfd.abfd.get(), section, currBfd.symbols.get(), offset, &file,                &func, &line))
{
auto demangled = demangle_cxa(func);
return demangled.empty() ? std::nullopt : std::make_optional(demangled);
}
return demangle_cxa(info.dli_sname != nullptr ? info.dli_sname : "") + " <bfd_error>";
}
return "<not sectioned address>";
}

std::pair<std::string, std::optional<unsigned int>> bfdResolver::resolve_filename_and_line(void* address)
{
// Get path and offset of shared object that contains caller address.
Dl_info info;
dladdr(address, &info);
if (info.dli_fbase == nullptr) {
return std::make_pair("<caller address to object not found>", std::nullopt);
}

if (!ensure_bfd_loaded(info) || s_bfds.find(info.dli_fbase) == s_bfds.end()) {
return std::make_pair("<could not open caller object file>", std::nullopt);
}
storedBfd& currBfd = s_bfds.at(info.dli_fbase);

asection* section = currBfd.abfd->sections;
const bool relative = section->vma < static_cast<uintptr_t>(currBfd.offset);

while (section != nullptr) {
const intptr_t offset = reinterpret_cast<intptr_t>(address) - (relative ? currBfd.offset :              0) - static_cast<intptr_t>(section->vma);

if (offset < 0 || static_cast<size_t>(offset) > section->size) {
section = section->next;
continue;
}
const char* file;
const char* func;
unsigned int line = 0;
if (bfd_find_nearest_line(currBfd.abfd.get(), section, currBfd.symbols.get(), offset, &file,                &func, &line))
{
if (file != nullptr) {
return std::make_pair(std::string(file), std::make_optional(line));
}
return std::make_pair(demangle_cxa(func), std::nullopt);
}
if (info.dli_sname != nullptr) {
return std::make_pair(demangle_cxa(info.dli_sname) + " <bfd_error>", std::nullopt);
}
}
return std::make_pair("<not sectioned address>", std::nullopt);
}

} // namespace instrumentation
In the above-provided code some of the parts are omitted such as BFD initialization, unwinder implementation, formatting the resolved frame or generating timestamp. It’s because I didn’t want to litter the article with copy-pasting too much code – the clue is to show the general idea and how it is realised.
The __cyg_profile_func_enter function should also be altered:
extern "C" NO_INSTRUMENT
void __cyg_profile_func_enter(void *callee, void *caller) {
if(fp_trace != nullptr) {
auto maybe_resolved = instrumentation::resolve(callee, caller);
if (!maybe_resolved) { return; }
fprintf(fp_trace, "%s\n", utils::format(*maybe_resolved).c_str());
}
}
We start from resolve function taking both callee and caller addresses. Underneath we in turn call separate functions for callee address (resolve_function_name) and caller address (resolve_filename_and_line) – since from the first one we can decode class and function name being called and the second one lets us pull out the information about the call site – the exact place from where the function was called. If we passed callee instead of caller address to resolve_filename_and_line function, it would point to the first line of definition of the called function.
Both functions use BFD objects to extract vital information. For the efficiency reasons they are stored in a static map and whenever any of them is required, they can be looked up and accessed without the necessity of creating those objects from scratch. Only when no suitable BFD object is found, it is constructed and inserted into the map.
If resolve_function_name fails to decode function name we are not proceeding to decode filename and line as well as we back off from logging the whole entry.
It’s also worth mentioning that caller address cannot be resolved in a standard way. There is some kind of bug in instruction pointer value resulting in a wrong call site being returned. Having said that, before passing caller address to resolve_filename_and_line function we firstly have to unwind nth frame, extract its address and only then pass it to resolve_filename_and_line. Fortunately the unwinding depth is constant and for current implementation it is 6. Unwinder uses libunwind library to achieve that.
Now our trace.out file will look as follows:
[13-06-2021 20:33:49.544] main  (called from: /build/glibc-S9d2JN/glibc-2.27/csu/../csu/libc-start.c:310)
[13-06-2021 20:33:49.600] A::foo()  (called from: /home/ubuntu/Desktop/call-stack-logger.8-final-with-identation-ready/src/main.cpp:39)
But there is still some room for improvement. To make it much easier to notice the actual flow of execution, we will introduce indentations. We will modify __cyg_profile_func_enter and add implementation for __cyg_profile_func_exit:
static int current_stack_depth = -1;
static bool last_frame_was_resolved = false;

extern "C" NO_INSTRUMENT
void __cyg_profile_func_enter(void *callee, void *caller) {
if(fp_trace != NULL) {
last_frame_was_resolved = false;
auto maybe_resolved = instrumentation::resolve(callee, caller);
if (!maybe_resolved) { return; }
last_frame_was_resolved = true;
current_stack_depth++;
fprintf(fp_trace, "%s\n", utils::format(*maybe_resolved, current_stack_depth).c_str());
}
}

extern "C" NO_INSTRUMENT
void __cyg_profile_func_exit(void *callee, void *caller) {
if(fp_trace != nullptr && last_frame_was_resolved) {
current_stack_depth--;
}
}
We declare static variable current_stack_depth which is incremented every time a frame is resolved successfully. We also store the information whether the last frame was resolved which is used to decrement current_stack_depth variable when we exit from a function.
Now we only need to additionally pass this variable into utils::format function and format the string whatever way we would like it to be printed in the log file.
Only one more thing – let’s modify a little bit our sample code to better visualize how the Call Stack Logger prints the entries in the log file:
class A {
public:
static void foo() { std::cout << "static foo \n"; }
};

class B {
public:
void foo() {
std::cout << "non-static foo \n";
std::vector<int> vec{ 1, 55, 78, 3, 11, 7, 90 };
std::sort(vec.begin(), vec.end());
A::foo();
}
};

int fibonacci(int n) {
if (n <= 1)
return n;
return fibonacci(n - 1) + fibonacci(n - 2);
}

int main() {
// Test logging static member methods.
A::foo();

// Test logging non-static member methods with calls to std
// functions/containers (which should not be instrumented).
B b;
b.foo();
fibonacci(6);
A::foo();
}
And here is the final result
Summary
As we can see, the output from the framework clearly visualizes the program’s flow of execution in the form of a tree structure. You may have noticed that as far as caller address is concerned, we only retrieve a filename and a line number from it. We are not decoding the name of the caller function, only the name of the callee function as the tree structure explicitly shows us the whole call hierarchy of the program, so we don’t need to additionally decode it and we are still able to say which function called which.
The solution introduced in Call Stack Logger may constitute an alternative to the standard debugging in many situations like the one when access to the production environment is limited and it is worth having such a mechanism as a backup in our pool of problem-solving tools.You can access Call Stack Logger on Github under:https://github.com/TomaszAugustyn/call-stack-logger


Leave a comment