To effectively utilize tools and frameworks, it is necessary to have a full understanding of their fundamental principles and functionalities. In today’s part of the series “Performance under control with k6,” we will present the process of recording test scenarios and ways to parameterize them. We will also discuss how to group scenarios and prepare code to ensure easy long-term maintenance.
Recording Test Scenarios
The essential element in preparing test scenarios is covering HTTP requests and operations performed by other protocols used in the application. The most common case is creating simple requests to the API interface.
There are two main methods of preparing scenarios:
- the first involves manually creating requests based on documentation and visible requests in the browser,
- the second method is recording network traffic using an available proxy.
Let’s discuss the two most popular ways of recording traffic through a proxy:
- using the k6 Browser Recorder extension created by the k6 tool developers,
- utilizing a HAR (HTTP Archive) file from the browser.
K6 Browser Recorder
K6 Browser Recorder is an extension for Firefox and Chrome browsers that allows generating a k6 script based on the traffic generated in the browser. It is the equivalent of the Blazemeter extension for JMeter. The only difference is that the data is saved in the k6 cloud, instead of locally, as in the case of Blazemeter.
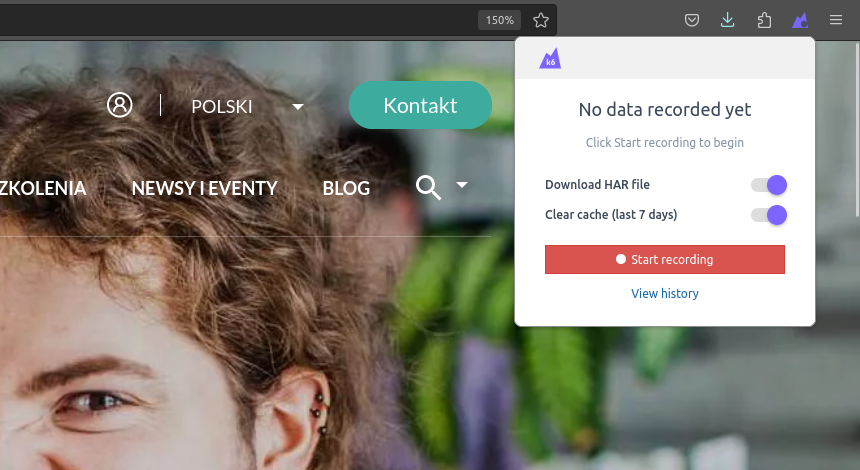
After clicking the “Start recording” button and executing the test path, you should stop the recording, which will take you to the panel with the saved scenario.
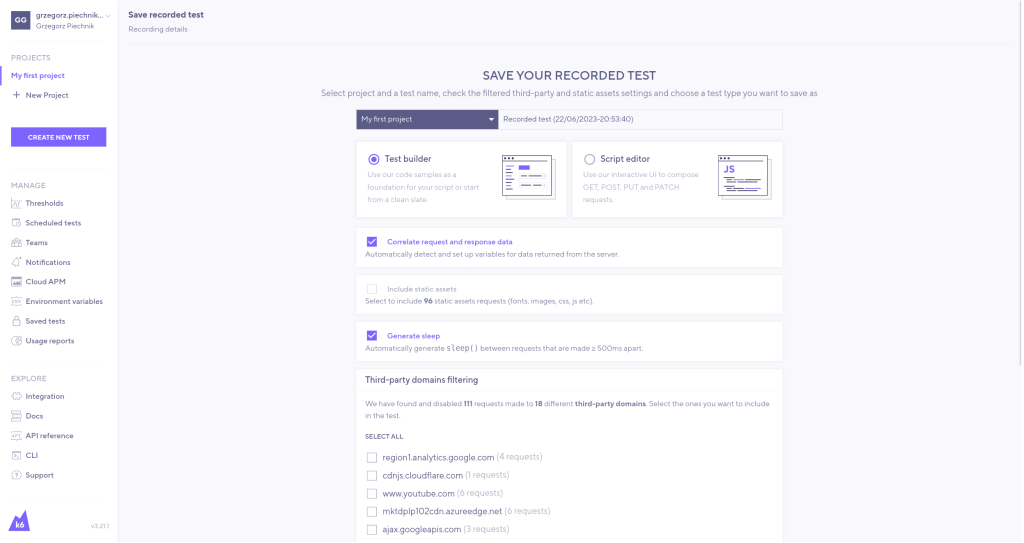
From the scenario panel, we will have the ability to perform various actions, such as excluding requests to third-party domains, adding automatic delays (sleeps), and including static files.
In our case, we are only interested in requests related to the main domain, without considering static files. After proceeding with the generation process, a test scenario will be generated based on the specified configuration.
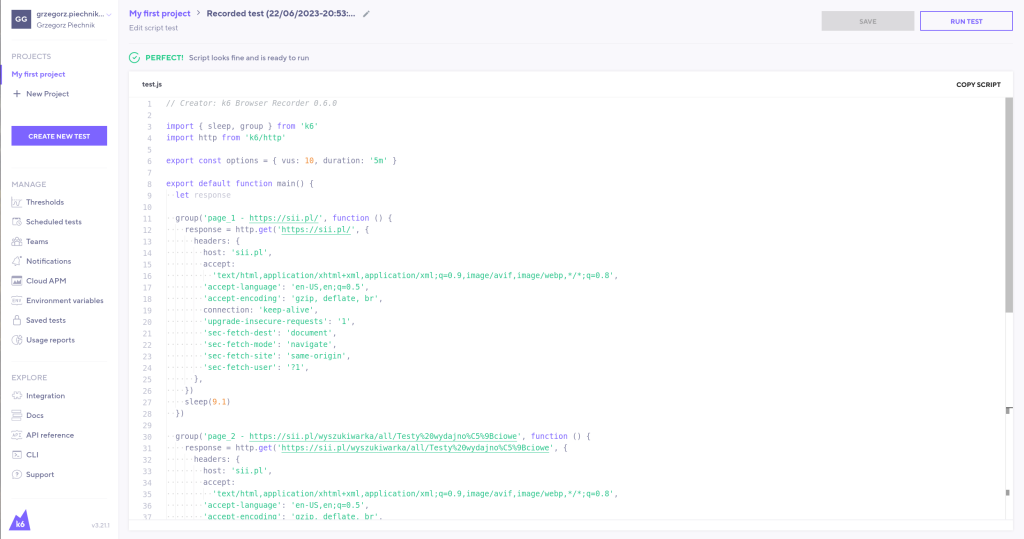
In its current form, many elements, such as headers, are repetitive. Furthermore, there is a lack of assertions and appropriate naming. However, before proceeding with editing, we will discuss a second method of recording test scenarios.
HAR File Conversion
The Grafana developers have provided the ability to generate test scenarios from sources other than the Firefox and Chrome browsers. All browsers generate network traffic during user interactions on a web page. This traffic can be saved in the HAR (HTTP Archive) format.
The HAR file contains:
- descriptions of HTTP requests,
- responses,
- resource files,
- loading times,
- errors, and other metadata related to interactions.
HAR files can be generated using various diagnostic and developer tools, such as built-in developer tools in web browsers, proxy servers, or performance testing tools for websites. For example, in the Firefox browser, we can download a HAR file with requests from the “Network” tab in the developer tools.
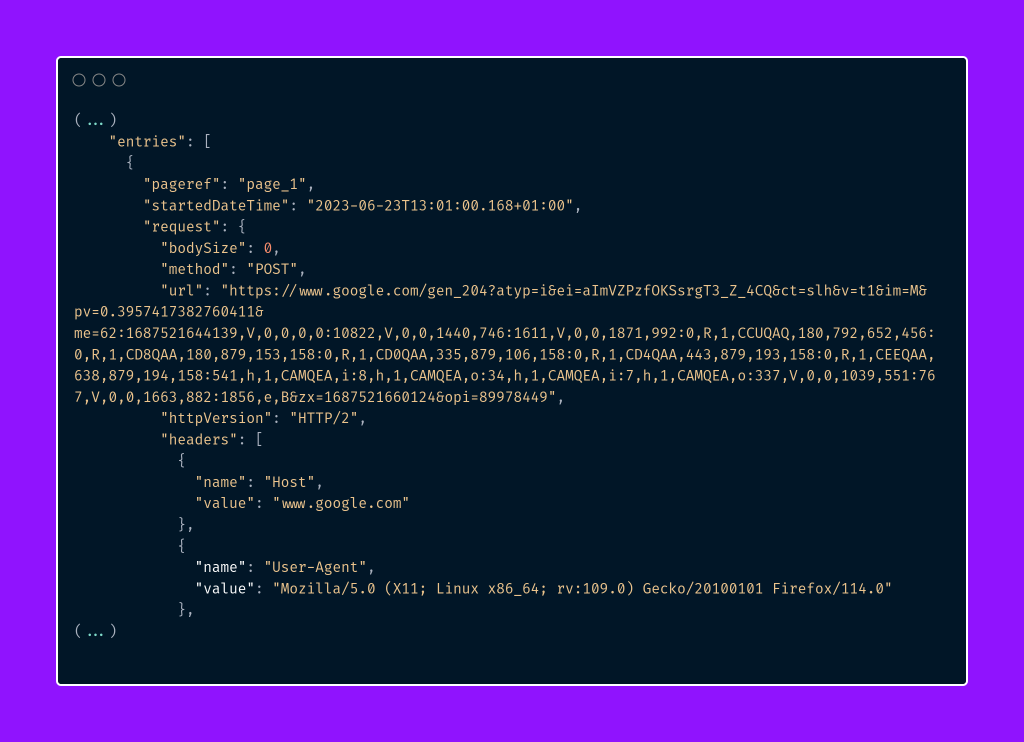
A sample part of a HAR file has the following format:
The developers at Grafana Labs have created a tool called “har-to-k6,” which allows the conversion of HAR files into k6 test scenarios. To install this tool, you need to use the Node.js package manager.
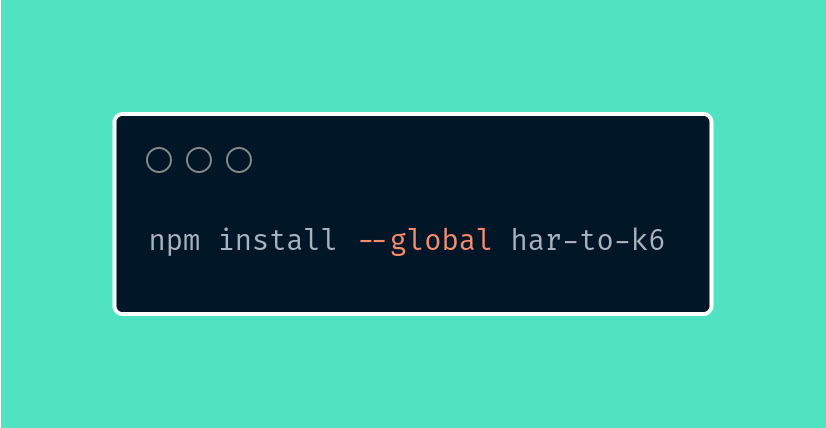
After successfully installing the “har-to-k6” tool, we can use the converter to process the downloaded HAR file.
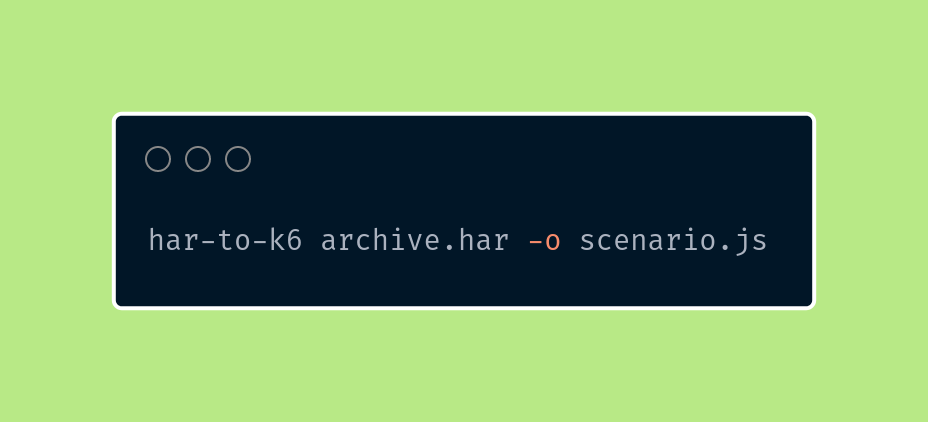
After using the “har-to-k6” tool, a k6 test scenario named scenario.js will be generated. Here is the sample content of the generated script:
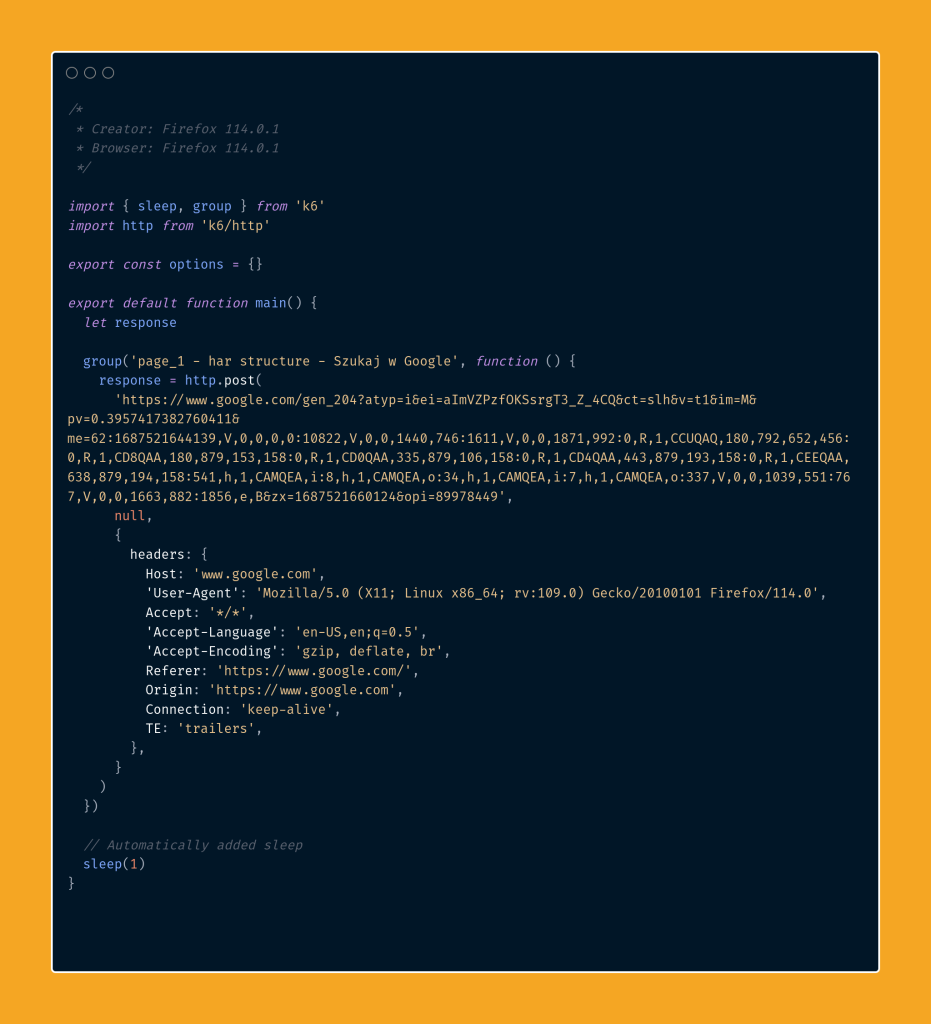
In comparison to using the k6 Browser Recorder, using the “har-to-k6” converter is less flexible. The HAR file structure does not have comprehensive documentation, which sometimes leads to issues with unhandled fields in the tools. Evidence of this can be seen in a recently detected problem in the well-known tool “mitmproxy“.
Reviewing the Generated Scenario
After generating the test scenario, it is necessary to edit and customize it. Let’s go back to the example scenario created by the k6 Browser extension to discuss it further.
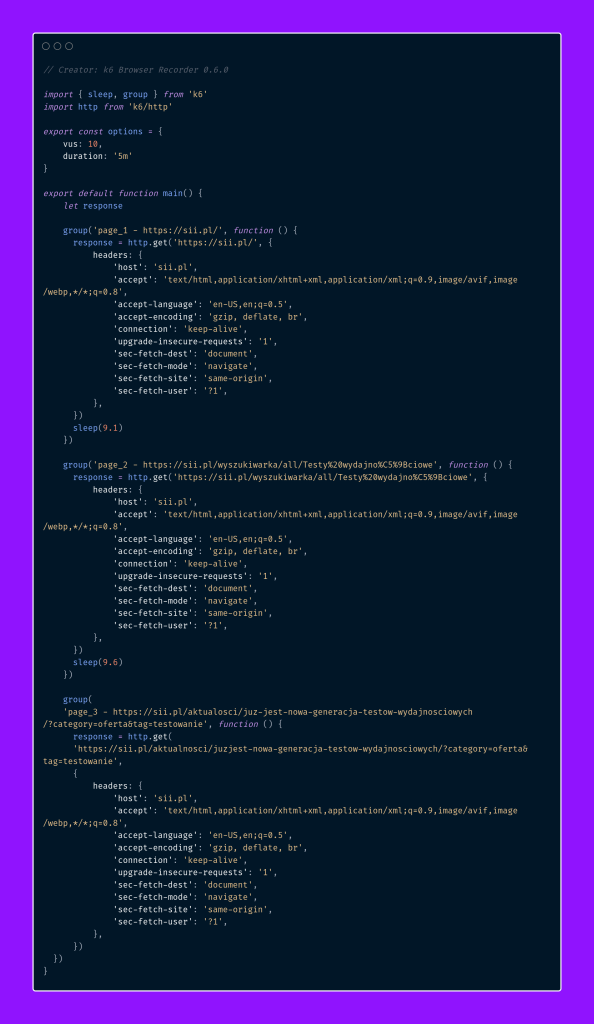
In the above case, the scenario consists of two main elements. The first one is the options object.
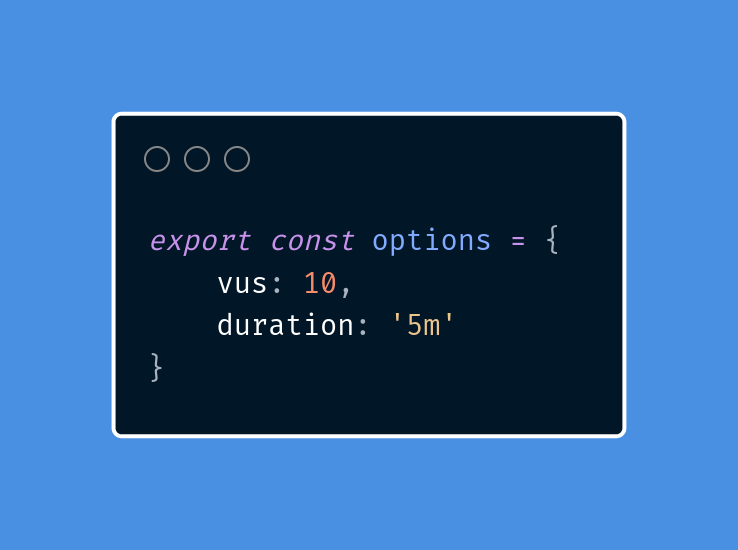
By defining the options object, we can specify various parameters such as:
- the number of concurrently running virtual users (vus),
- the test duration (duration),
- quality thresholds (thresholds).
We will discuss this object and its capabilities in detail in the upcoming parts of the series. Currently, there are over 50 different options that can be defined.
The second element of the generated scenario is the main() function. It is where we define HTTP requests and data operations.
Parameterization
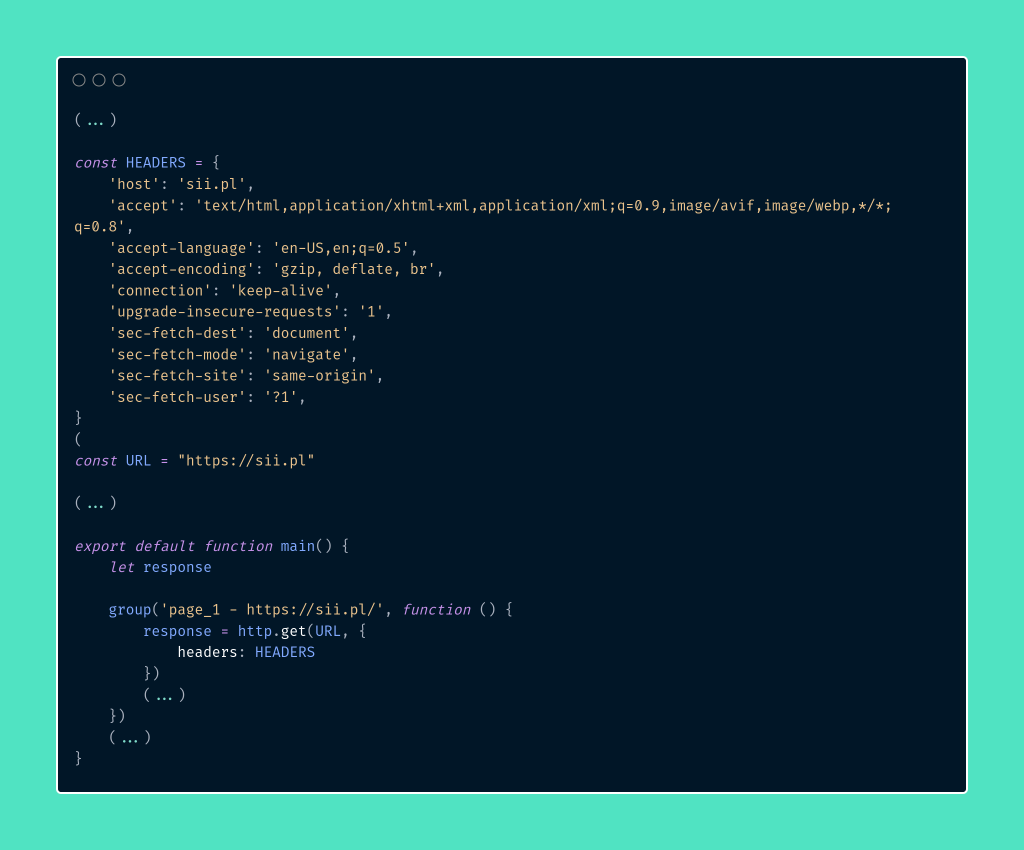
Currently, one of the most common mistakes is the inability to reuse HTTP headers and URLs multiple times. To address this issue, we can modify the scenario slightly to avoid redefining them for each HTTP request.
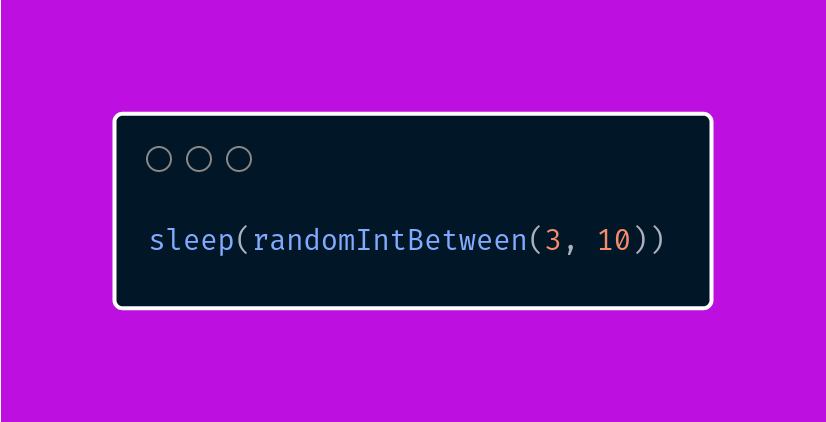
Another important element of the test is the interaction time between different parts of the page. In the case of the generated scenario, the user’s rest time is 9.1s and 9.6s. We assume that the response time can vary from 3 to 10 seconds.
At this stage, let’s also introduce some randomness when opening specific articles. For this test, we assume that there are only five fixed articles. To introduce randomness, we can use the k6-utils library.
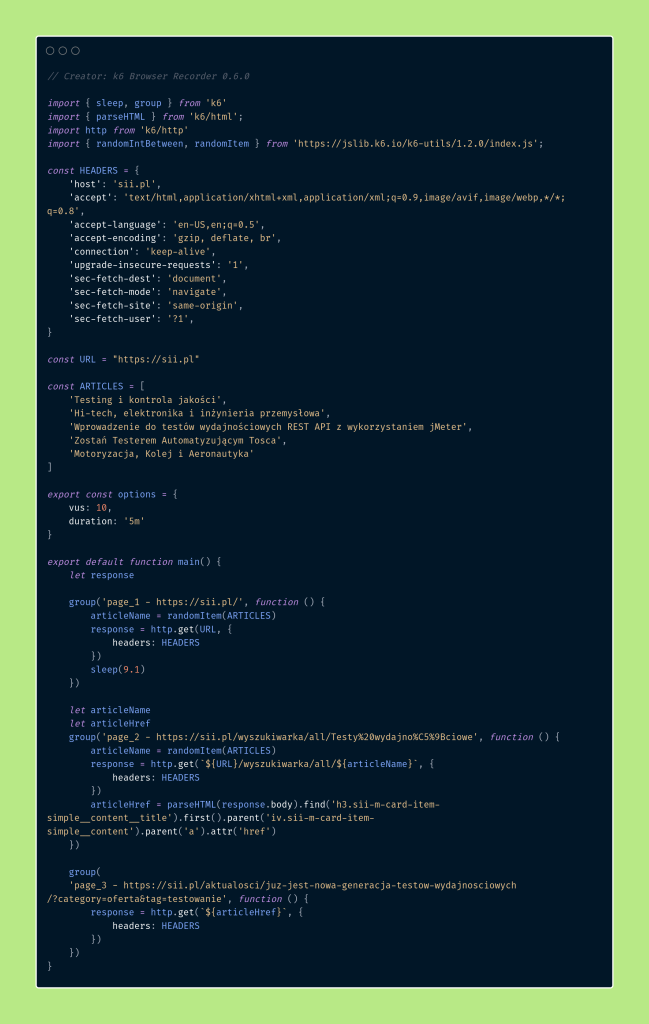
To extract data from the application, such as the article name or source address, we used built-in functions for manipulating HTML files. These functions may resemble those known from functional testing frameworks like Cypress or Selenium.
Let’s pay attention to the placement of variables articleName and articleHref – why are they defined before the group? Let’s discuss this a bit more broadly.
Grouping Requests
To maintain consistency in test steps, it’s beneficial to use grouping. This can be likened to transaction controllers in JMeter. In k6, all variables defined within a group are only accessible within that group. For example, if we define articleName inside the second group, its value won’t be accessible in the third group.
Grouping is also useful when we want to collect several requests made at the same stage of the test. For instance, when we visit the homepage, we often make multiple parallel HTTP requests. In this case, all these requests can be in one group named “Homepage Visit.” Let’s introduce a change in the naming in our test.
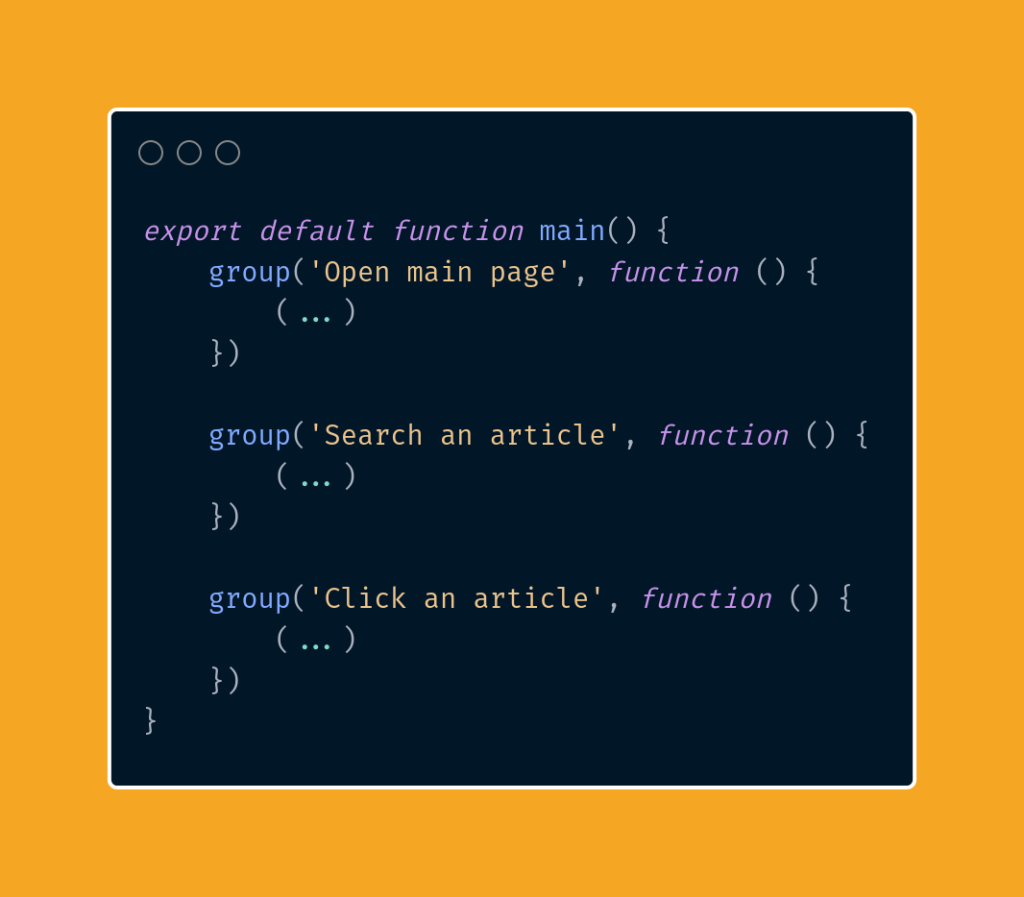
In this way, we will easily maintain our tests even if we add or remove relevant requests. There will be no issue with their identification, and as we will see in the upcoming parts, it will facilitate analysis in third-party tools.
Assertions and Checks
Let’s notice the absence of assertions in our test scenario. In programming, an assertion is a mechanism used to verify conditions or assumptions during program execution. It is a way of verifying whether certain expectations are met, which helps in error detection. In the case of an incorrect assertion during the test, its execution is interrupted.
In the implementation of k6, assertions have been replaced with checks. Checks are similar to assertions, with the difference that the test is not automatically interrupted after receiving an erroneous response.
Checks take the response object as their first argument. This object contains several fields on which assertions can be made.
The most commonly used fields in checks are:
- the server status (status),
- response body (body),
- and response headers (headers).
Let’s define a sample check that verifies whether the response status is correct and the response body contains the expected text.

Using the above mechanism, let’s edit our script.
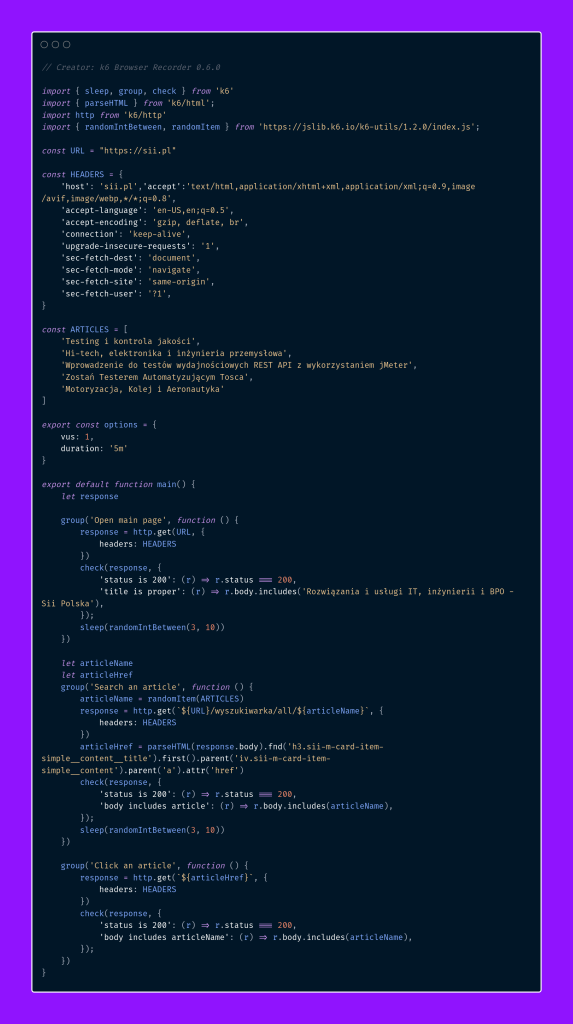
If we decide to use traditional assertions, we will have to use our own custom-defined function. Unlike the built-in check function, which returns true or false, we can utilize this information to stop the current test iteration (goroutine) and start a new one.
For this purpose, we can use the built-in fail function.
Summary
In today’s part of our series, we familiarized ourselves with the basic functionalities of the k6 tool. We learned how to record test cases, parameterize them, and create a basic test scenario. In the upcoming parts, we will focus on setting quality thresholds, discuss tagging, and explore various types of metrics.
If you haven’t had a chance to read the previous introductory part, we encourage you to do so. There, you will find more information about our introduction and the motivation behind choosing the k6 tool.
In the following parts of the series, we will continue to develop our test scenario to tailor it to more advanced needs and delve into the functionalities of k6. We encourage you to follow our series to learn more about this powerful performance-testing platform.


Leave a comment