To fully understand system performance, it is essential not only to conduct tests but also to build observability. Integration of third-party tools becomes crucial in achieving complete visibility and time-based data analysis, allowing for real-time monitoring of applications, identifying potential issues, and taking appropriate actions to enhance performance.
In this article, we will explore how building observability for systems is critical in the context of performance testing and how to effectively integrate k6, Grafana, and InfluxDB to obtain comprehensive and accurate test results. However, we need to grasp the fundamental theory before implementing our integrations.
What is Docker and Docker Compose?
Docker is an open-source platform that enables operating-system-level virtualization. It allows packaging applications and all their dependencies into units called containers. Each container runs in isolation, meaning it can have its libraries, configuration files, and other dependencies independently of other containers on the same host. This makes applications run in containers portable and uniform across different environments, from local developer machines to production servers.
Docker empowers developers and administrators to create, deliver, and run applications in an automated and repeatable manner. This makes the application deployment process more reliable and faster while eliminating issues related to differences in environment configuration.
On the other hand, Docker Compose is a tool that extends Docker’s functionality, enabling the management of multiple containers as single applications. It allows defining an entire application environment in a single configuration file, where you can specify all the containers, their dependencies, networks, and other parameters. This makes it easy to start and stop an entire application consisting of multiple containers with a single command.
Docker Compose is particularly useful in developer and testing environments, where multiple services and dependencies are often utilized. It helps:
- shorten the setup time,
- automate processes,
- and avoid issues related to manual management of multiple containers.
Storing metrics in InfluxDB
InfluxDB is a distributed time-series database designed for storing, querying, and analyzing time-based data, such as:
- telemetry data,
- event logs,
- application metrics,
- or measurement data.
InfluxDB provides an efficient and scalable solution for storing large amounts of data with a time-changing nature. Due to its specialization in time-based data, it is frequently used in IoT applications, system monitoring, real-time analytics, and other domains requiring precise collection and analysis of time-based data.
InfluxDB is an ideal tool for storing metrics from performance tests and other applications related to time-based data analysis. Its specialization in time-based data allows for precise collection and archival of performance test results, such as server response times, requests per second, or system load.
InfluxDB is a popular choice among performance testing and system monitoring teams because it offers efficient and reliable data storage and easy integration with other data analysis and visualization tools. This enables us to build advanced and comprehensive solutions for performance analysis, which is crucial for ensuring the optimal operation of our systems.
Data visualization with Grafana
Grafana is a popular open-source tool for visualizing and monitoring data from various sources. It is primarily used for creating interactive and visually appealing charts, panels, and dashboards that allow for visual analysis and presentation of data. Grafana collaborates with many databases and monitoring systems, with InfluxDB being one of the most commonly used data sources.
Tool enables integration with InfluxDB, making visualizing time-based data stored in the InfluxDB database easy. This integration allows us to create advanced line charts, bar charts, pie charts, heatmaps, and more based on performance test results and other time-based data. These visualizations help us understand changes in application performance over time, identify trends, and pinpoint potential issues.
Grafana also offers advanced features such as dynamic filters, interactive panel toggling, combining different data sources, and much more. This allows us to tailor the presented data to our needs and generate personalized reports and dashboards that help us effectively monitor and analyze the performance of our applications.
When combined with InfluxDB, Grafana becomes a powerful tool for comprehensive monitoring and visualization of time-based data, particularly valuable for performance testing and time-related data analysis. This enables better understanding and optimization of application performance, which is crucial for ensuring excellent quality and performance of our systems.
Workflow summary
In summary, we will use Docker in our project to create and configure communication containers. Ultimately, we will create three containers with the following communication pattern:
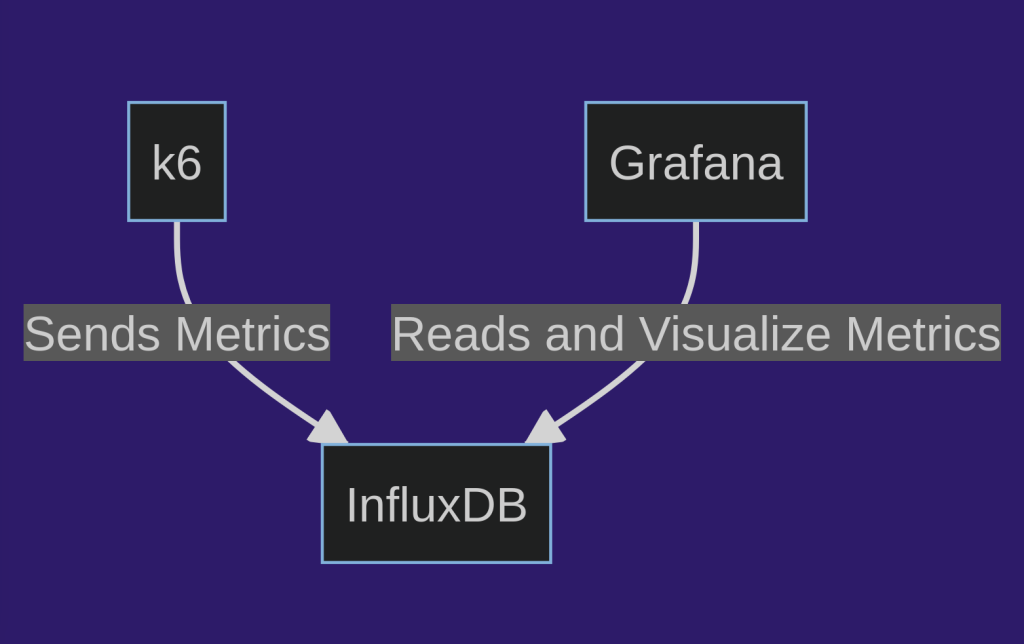
This is a simple and standard integration, which is a starting point for developing a monitoring system.
Before we move on to creating the docker-compose.yaml file, we first need to build a Docker image responsible for running the test scenarios based on the commands defined in the package.json file. Here is the ready configuration for the Dockerfile:
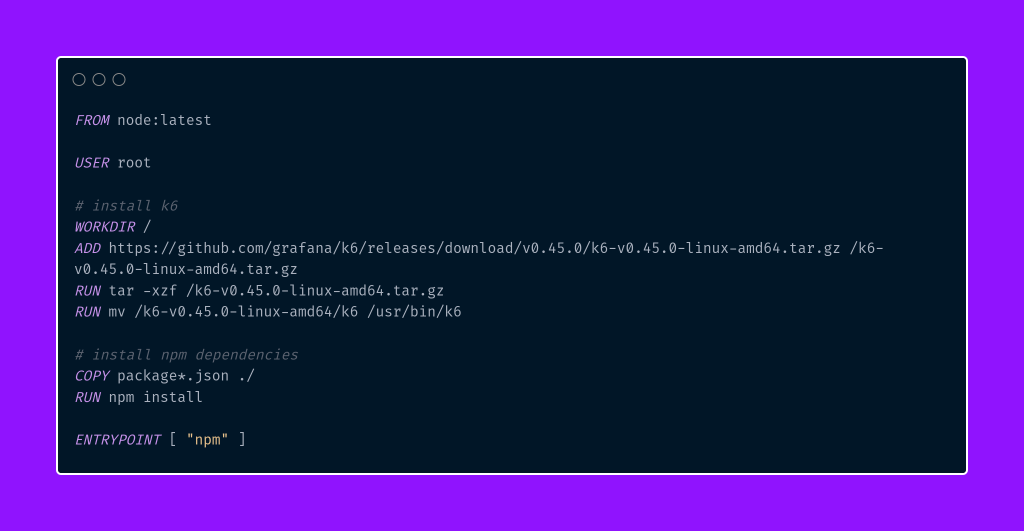
The above Dockerfile describes the process of building a container image that contains the environment for running k6 tests and installs the required dependencies related to Node.js and npm. Here is its breakdown:
- FROM node:latest – this line specifies the base image on which the container image will be built. In this case, the “node:latest” image is used, which includes the Node.js environment, enabling the execution of JavaScript scripts.
- USER root – setting the user to “root.” This line is optional and only required if we need administrator privileges to install and modify packages.
- WORKDIR / – specifies the working directory inside the container to the root directory (“/”). All subsequent commands will be executed in this directory.
- ADD … – downloading the k6 archive with the specified version (0.45.0) and unpacking it inside the container.
- RUN … – executing subsequent commands. Unpack the k6 archive, move the k6 executable to the “/usr/bin” directory, and install dependencies from the package.json file using “npm install.”
- ENTRYPOINT [ “npm” ] – specifies the entry point into the container. In this case, npm will be automatically executed when the container is run, allowing the execution of test scripts defined in the package.json files.
Let’s implement and discuss the docker-compose.yaml file in which we will describe the structure of our containers.
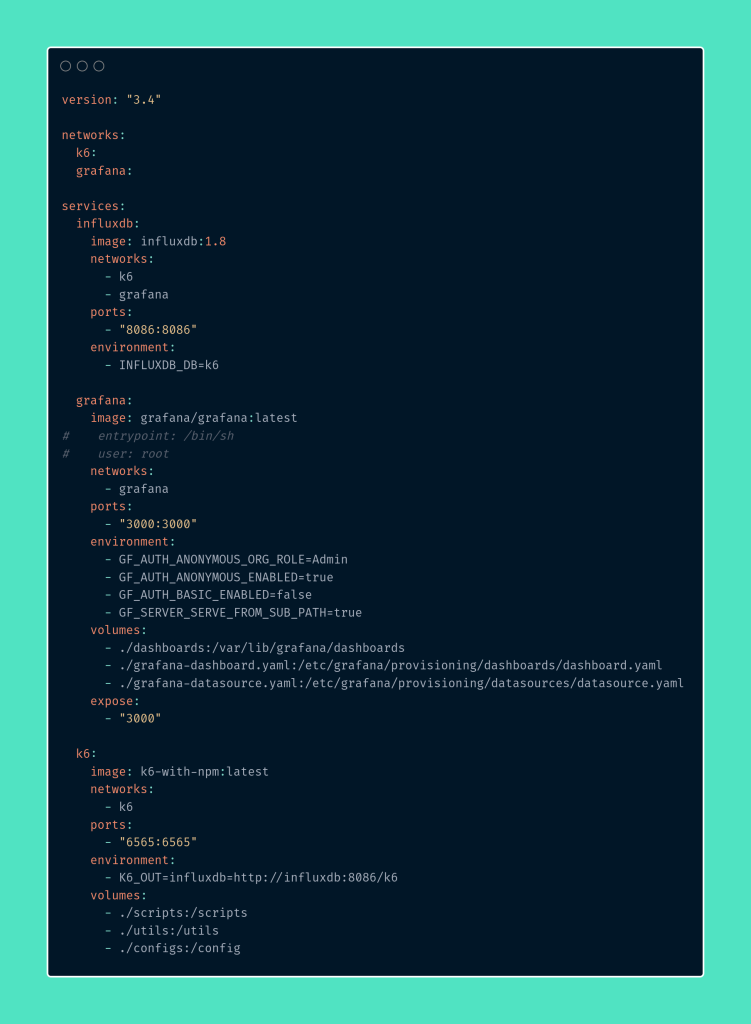
In the above docker-compose.yaml file structure, three services have been defined, creating a comprehensive environment for performance testing. Each service is responsible for specific tasks:
- InfluxDB – a time-series database that stores data collected during performance tests. The image version “influxdb:1.8” is specified along with its associated parameters. The service is connected to two networks, “k6” and “grafana,” enabling communication with the other services. Port “8086” is exposed to allow access to InfluxDB from other containers. An environment variable “INFLUXDB_DB” is defined, specifying the name of the “k6” database in InfluxDB.
- Grafana – this service allows visualization and analysis of time-series data stored in InfluxDB. The “grafana/grafana:latest” image is used, and relevant parameters are defined. The service is connected to the “grafana” network. Port “3000” is exposed, enabling access to the Grafana interface from an external environment. Environment variables are also configured to allow anonymous access to Grafana.
Additionally, the docker-compose.The yaml file includes volumes that allow the provision of configuration files and dashboards to the Grafana container. The first volume is for the newly created directory dashboards, where the panels we define will be located and automatically imported by the Grafana container. An example panel we will use is available in our repository, to which we warmly invite you.
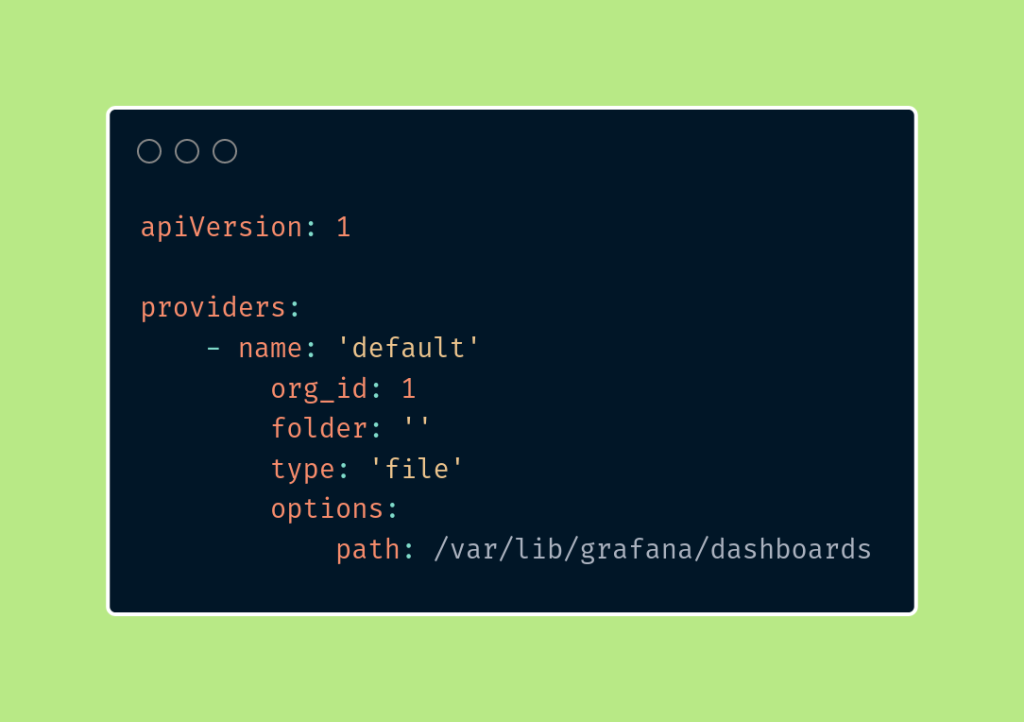
Let’s discuss the next two configurations defined in the docker-compose.yaml file for the Grafana services.
- The grafana-dashboard.yaml file – defines a dashboard provider for Grafana. This configuration specifies that new panels will be associated with the main folder and provided from files in the /var/lib/grafana/dashboards directory. This approach enables the automatic addition and management of panels in the Grafana system using configuration files.
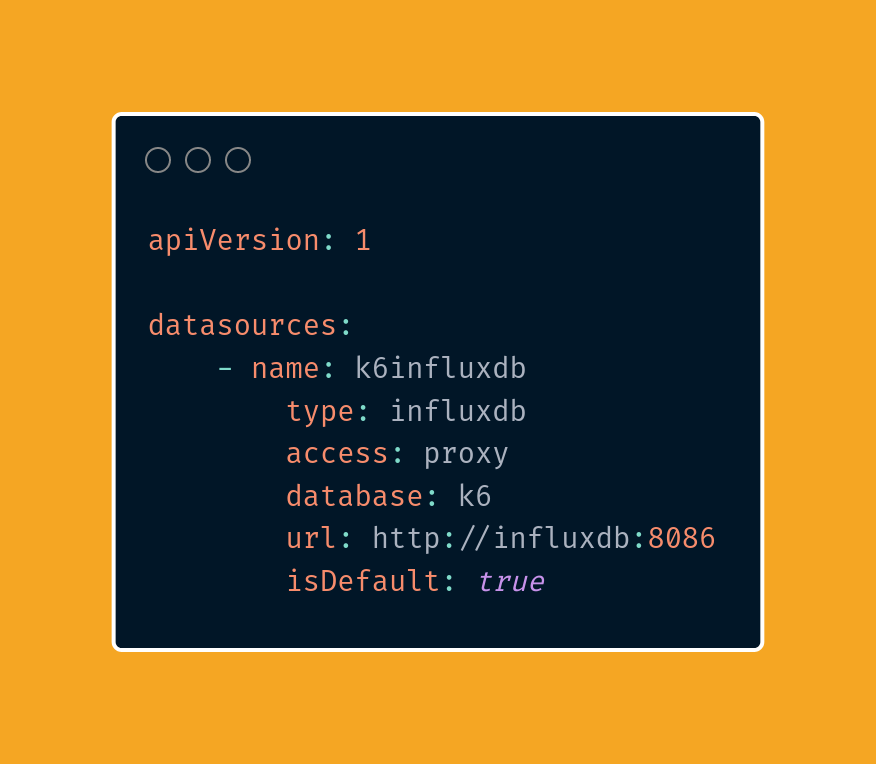
- The grafana-datasource.yaml file – contains the data source configuration for Grafana, pointing to the InfluxDB database named “k6.” With this setting, Grafana will use this data source as the default, enabling automatic utilization in panels that do not have a specific data source selected. The data source is accessible through a proxy at the address “http://influxdb:8086“.
- k6 – this service is responsible for executing performance tests. The k6-with-npm image we created a moment ago is defined, and the “k6” network in which the service operates is specified. Port “6565” is exposed, allowing access to the k6 interface. An environment variable, “K6_OUT,” is configured, pointing to the InfluxDB database and its endpoint “http://influxdb:8086/k6“, where test results will be stored. Additionally, through a volume, test scripts and their helper directories are accessible on the local system within the k6 container.
A detailed explanation of the complete functioning of docker-compose.yaml and Docker itself would require a separate and detailed series of articles. This article focused on providing a general overview of these concepts. However, we plan to create a separate series to delve into Docker from the basics.
In summary, the entire environment in docker-compose.yaml is configured in a way that enables automatic operation and communication between individual services. InfluxDB collects data from performance tests, which can then be visualized and analyzed in the Grafana interface, while the testing process itself is handled by k6. This makes the environment easy to deploy and scale, making it a good starting point for monitoring and analyzing application performance.
Preparing before running the scenario
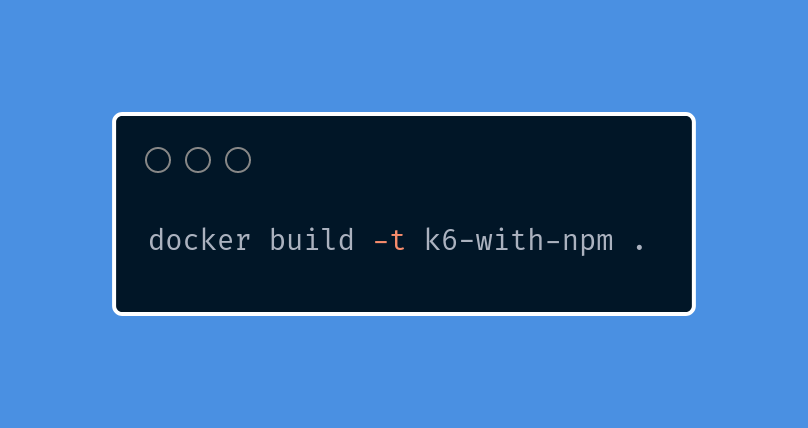
To run the environment locally correctly, ensure you have Docker and Docker Compose installed. Then, navigate to the project’s main directory and execute the following command to build a Docker image based on the Dockerfile we created earlier.
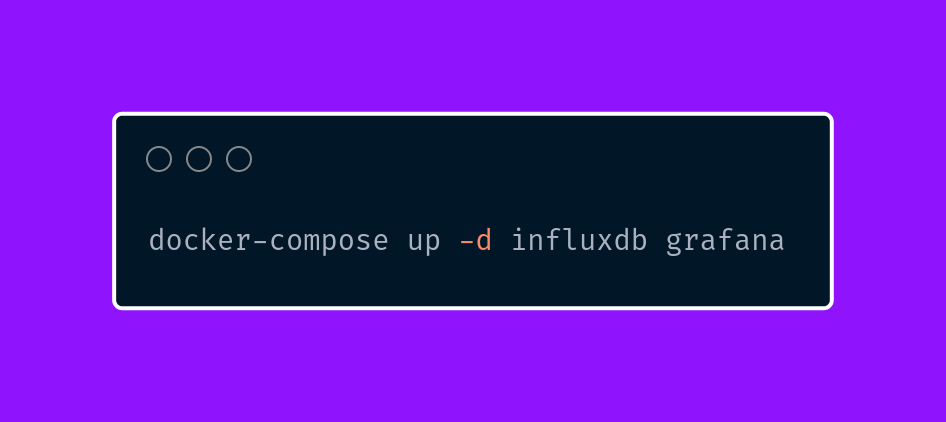
We are ready to create and run the InfluxDB and Grafana containers.
By defining access to the Grafana interface in the docker-compose.yaml file, we can now access the Grafana dashboard using the address 127.0.0.1:3000 within the available environment.
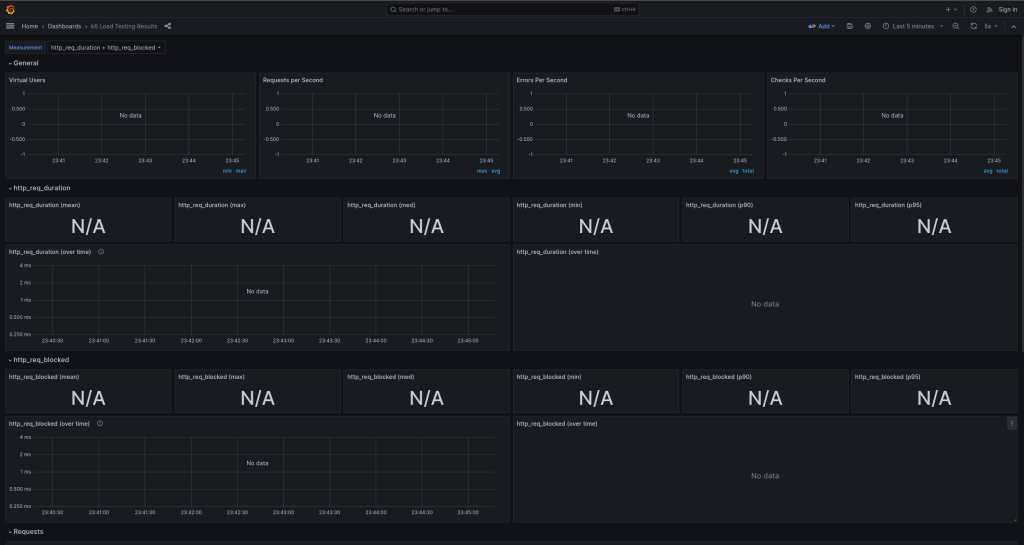
However, since we haven’t started the k6 container and thus the test scenario, no results are visible yet.
The final steps
Before running our scenario, let’s make minor changes to the assert helper function. Let’s modify it to accept more arguments, including the crucial errors object.
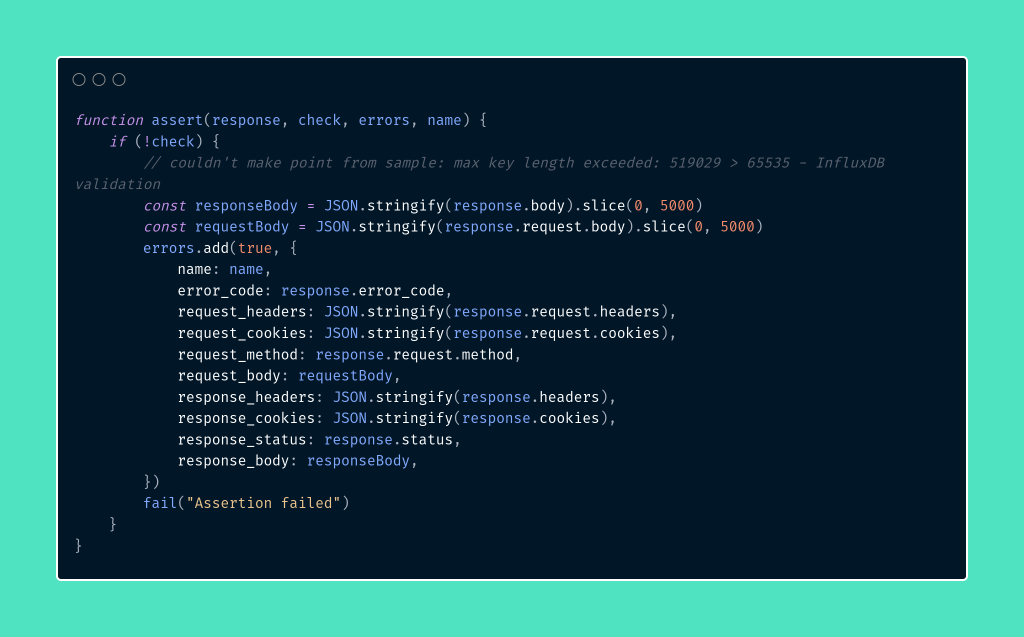
The above change is because k6 doesn’t handle logging application errors precisely enough, making it difficult to analyze and draw conclusions. Therefore, we expanded our function to pass more detailed data. These details are aggregated in the errors object, defined in each test scenario right after the import section. We introduce this logic in the scenario responsible for searching for training courses. You can find the complete changes in our repository.
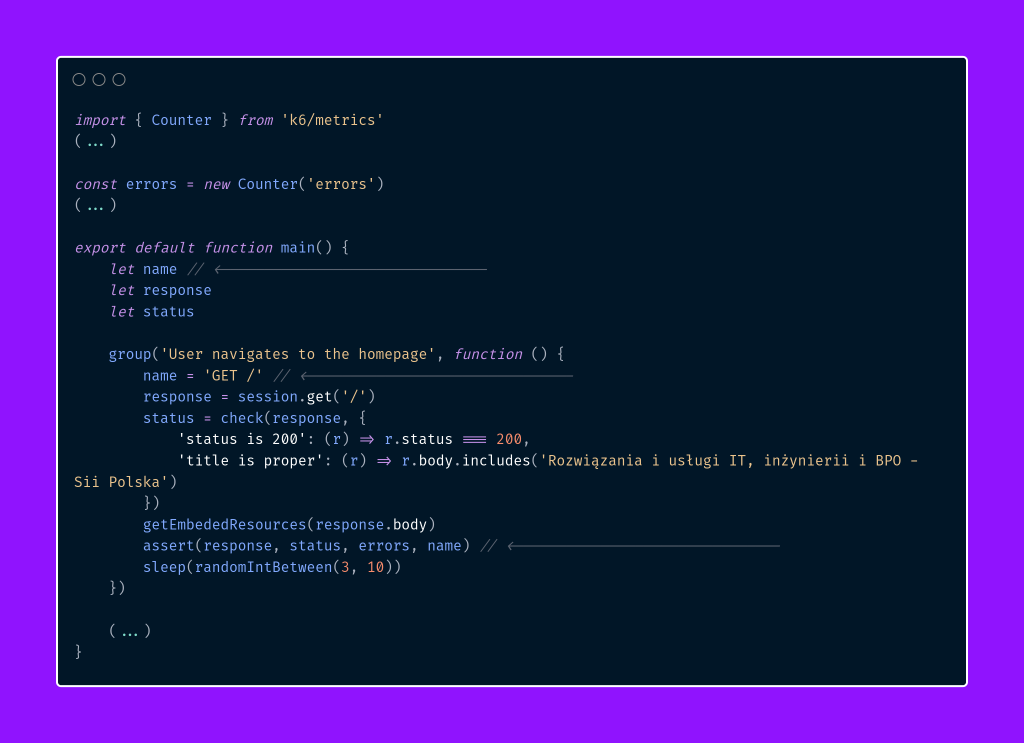
After making the necessary changes, let’s execute the following command to remove existing k6 containers and then run the defined command from the package.json file:
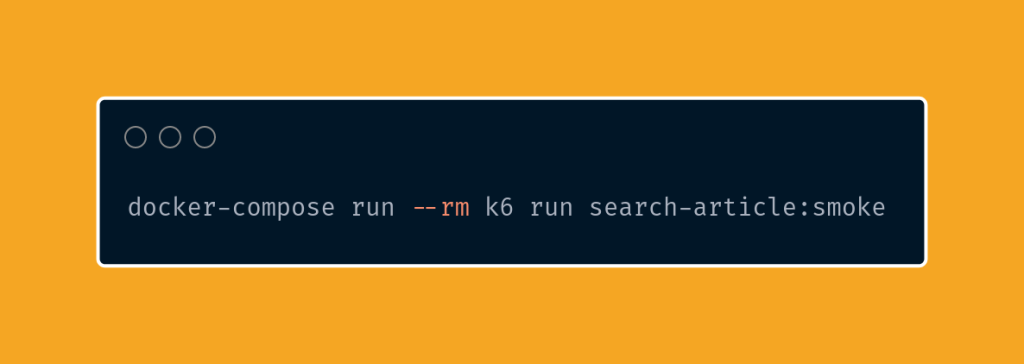
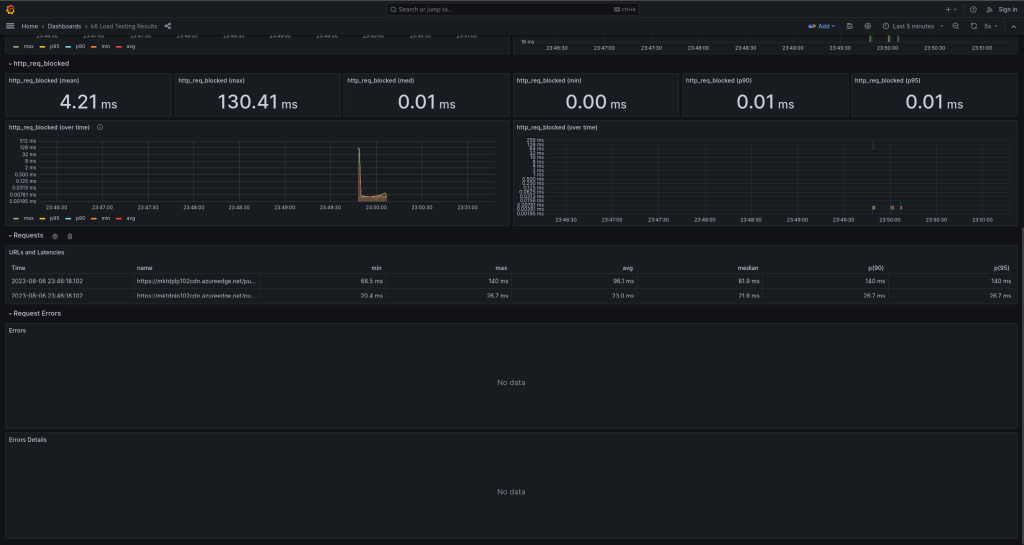
This way, a single run of the test for searching an article on the website will be executed. Let’s move to Grafana to check if the results are displayed correctly.
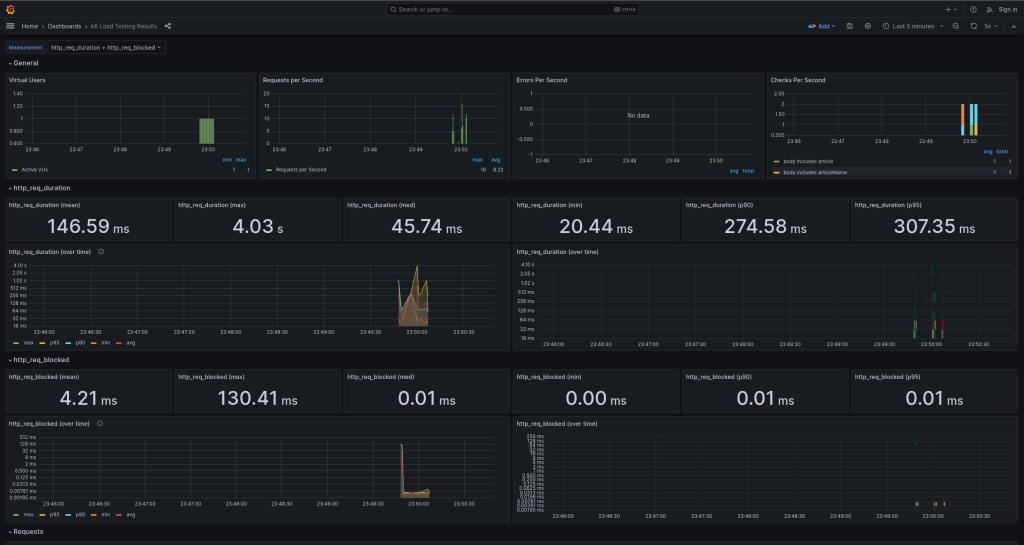
Additionally, if an error is detected, it will be displayed in a table at the bottom of the panel, divided into two sections. The first section groups and summarizes the detected errors, while the second section provides a more detailed view of these errors.
Summary
In this article, we delved into integrating the k6 tool with Grafana and InfluxDB, opening up new possibilities for monitoring and visualizing performance test results. Through Grafana, we created interactive and aesthetically pleasing charts based on data stored in InfluxDB, making it easier to analyze test outcomes.
Furthermore, we learned that Docker is an excellent tool for container isolation and deployment, enabling easy installation and execution of necessary tools. Integrating these technologies allowed us to enhance the observability of our performance tests, a crucial aspect in building reliable and efficient applications.
***
If you haven’t had a chance to read the articles in the series yet, you can find them here:
- Performance under control with k6 – introduction
- Performance under control with k6 – recording, parametrization, and running the first test scenario
- Performance under control with k6 – metrics, quality thresholds, tagging
- Performance under control with k6 – additional configurations types of scenario models and executors
- Performance under control with k6 – framework initialization
- Performance under control with k6 – best practices, test suite creation, and configuration
In addition, I encourage you to check out the project’s Repository.





Leave a comment