In the first part of the series of articles on Playwright, I showed you how to use the tool along with C#. You can read the article on the Sii blog. This time I would like to discuss a useful feature available in Playwright – the so-called Trace Viewer. It distinguishes Playwright from other tools and gives the user access to a detailed test report. This allows finding errors and thoroughly tracing what went wrong, enabling catching an application error even more accurately. Additionally, it provides detailed information for developers.
What is Trace Viewer for?
Trace Viewer can support us through:
- Screenshots – after each action, Playwright creates a screenshot. Thanks to the significant number of screenshots taken during the test, Playwright provides an accurate test run.
- Snapshots – the entire HTML DOM for each action is downloaded.
- Sources – this property allows setting information in the Trace Viewer about what line of code triggered a specific action.
All this information is useful when, for some reason, the test tends to work one time and not work another. Also, when the test is working properly, presenting the test in this form can be useful for the whole team, or when the error occurs in the application and not in the test itself, it is easier to trace what went wrong. It is easier for us to find out why a particular test does not pass. We can decide on our own through Playwright’s configuration files whether we want to enable the use of the Trace Viewer during tests or not.
Let’s begin!
To obtain useful logs, we need to initialize the use of “Tracing” during our tests.

In the settings of the Context.Tracing.StartAsync() method, we define what logs are to be saved when we run our automated tests. Screenshots save a record of each action during the test. Snapshots save the HTML DOM of each action that happens. Sources allow collecting information about which line of code is responsible for a particular action.
In addition to using the StartAsync() method, in the end, we need to define in the class the ending of log saving in the TearDown method, which allows us to indicate the name under which we will save the .zip file with the logs. It is worth adding the so-called Guide in the name – it will give us a unique name for the log file every time we run a test. In a situation where the name is fixed, for example just “blog_sii_meetup”, every test run will exchange the report.
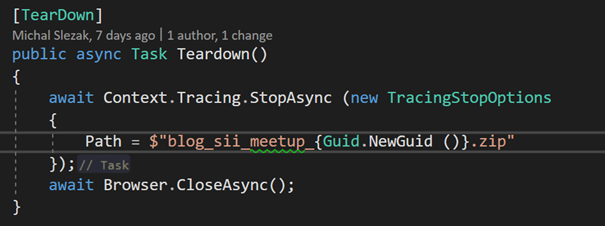
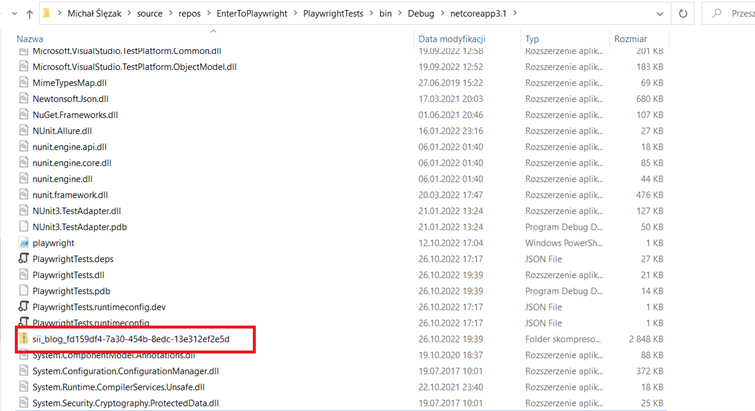
After running the test, the .zip file with the logs will be saved in the project’s bin directory. You can find these methods alongside sample tests in the code available on Sii’s GitHub in the BaseSetup.cs class. I recommend downloading and checking them locally.
Running the test
First, I recommend going into the system’s directory, where the log file is located. The bin directory is the default location, unless you chose a different path during the Trace Viewer setup. Here, I open PowerShell and run the .playwright.ps1 script, which contains various useful features you can use.
In that case, to see the Trace Viewer, I run the command:
playwright.ps1 show-trace nazwa_pliku_z_logami.zip
- File_name_with_logs.zip – this is the newly generated log file, created each time the test is run.

Displaying the report
After running the script, a menu with various options will be displayed. In this case, we are interested in the “show-trace” option, which, basing on a given .zip file, allows us to display a report. First, we see a screen with all the actions collected during the running test displayed on the left.
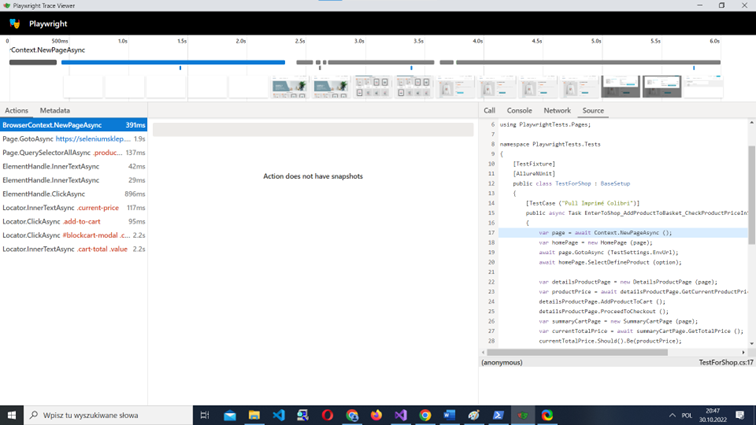
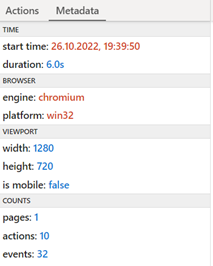
The first tab in the Trace Viewer is responsible for collecting actions performed during our test. The second, located next to it, is “Metadata”. It contains basic information about the duration, resolution, and time of conduct of the automated test.
In the following steps, in the middle of the screen, the Trace Viewer provides us with a screenshot of the test run. In this case, this space is still empty because, in this step, the test has just started, and the viewer has not yet been launched.
On the right side of the Trace Viewer there are other useful options. They include information on:
- actions,
- console,
- information derived from the console,
- code references.
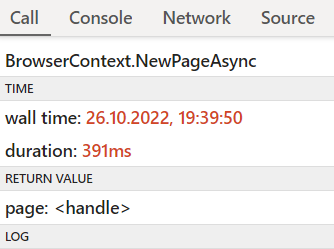
- Call – contains potential logs and information about what action took place and how long it lasted.
- Console – contains information (if there is any) from the console.
- Network – contains information (if there is any) about particular requests.
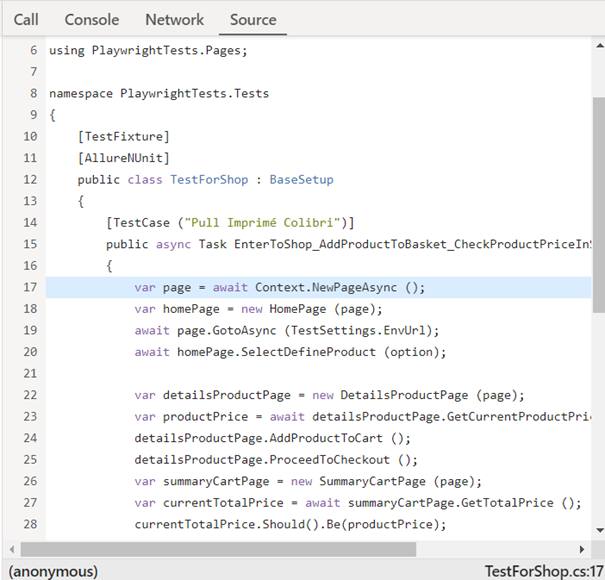
- Source – contains information about which line of the code is responsible for the current step. In this case, it is line 17, which Playwright highlights here. Each subsequent action that we select from the menu on the left will be traceable. A screenshot will be available for the action of moving to a specific page (in this case, in line 19).
Summary
In today’s post, I have shown you how to use the Trace Viewer and generate an accurate test run report. Keep in mind that the report itself is generated by default for each test separately and that it affects the timing of test runs. However, we can decide when we want to generate it, for instance, when an error sometimes occurs.
In the next article, I will demonstrate how we can record a video of the test and integrate Playwright with Allure, a popular tool for creating test reports.
Playwright Trace Viewer in practice
***
On our blog you will also find other articles about Playwright.






Leave a comment