In today’s times, when most web applications have millions of users worldwide, their performance, failover, and availability are of crucial importance. Therefore, performance testing is an integral part of the software development process, and tools for conducting it are essential for every development team.
This article marks the beginning of a series in which we will focus on discussing one of the fastest-growing application performance testing tool – k6, developed by Grafana Labs. Throughout the series, we will analyze how k6 works, the features it offers, and how to configure it to conduct effective performance tests and analyses.
We will also delve into advanced aspects of using k6, such as creating extensions, which are essential for conducting tests, and demonstrate how to deploy and manage observability within your own systems.
What is k6?
Before we delve into the technical aspects of the k6 tool, it’s worth mentioning what it is and how it came into being.
In 2016, the LoadImpact team embarked on developing a new open-source tool designed solely for conducting performance tests. However, as it later turned out, they didn’t limit themselves to just that. In 2017, LoadImpact decided to release the tool under an open-source license, and since 2020, it has reached version 1.0. From that point on, k6 has been developed by an independent team of developers and a wide community.

K6 is a tool designed for generating load for performance testing purposes. Similar to NeoLoad, jMeter, Gatling, or Locust, it allows generating nearly any number of transactions per second, thereby simulating the behavior of users in web or mobile applications. It also excels as a tool for API testing.
K6 comes with built-in support for seamless integration of test execution with the CI/CD process using tools such as Jenkins, TeamCity, Bamboo, and many others. Additionally, by utilizing ready-made converters, you can incorporate previously prepared API test scripts, such as those from Postman, into your performance tests.
However, what sets k6 apart from other performance testing tools is its ability to conduct in-depth network analysis, perform functional tests, and even chaos tests. This capability allows for the straightforward maintenance of a single framework for all testing-related aspects, enabling development in multiple areas simultaneously.
It’s important to remember, though, that the primary focus of k6 is on performance testing. As such, the k6 team pays special attention to HTTP and websocket protocol handling, as well as metrics collection, often overlooked in other tools.
These metrics include:
- Time spent waiting for access to a free TCP slot.
- Time spent during TLS session handshake.
- Time spent waiting for a response from a remote host (time to first byte).
Proper utilization of this data, combined with integration with other tools, enables more advanced application analysis.
K6 Cloud vs k6 Open Source
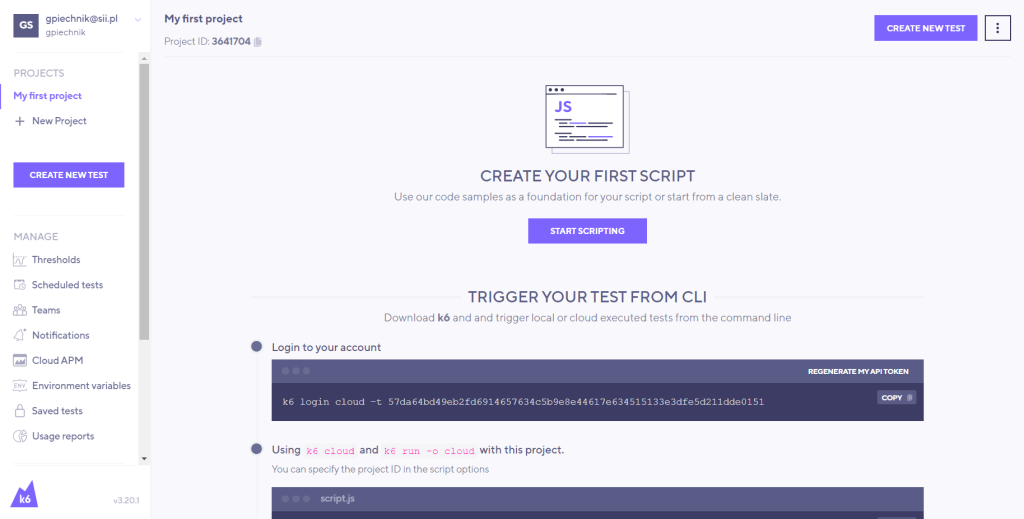
k6 comes in two versions – open source and Cloud. In this article series, I will focus on the open-source part, as it is sufficient for working on mature projects.
Opting for the Cloud version comes with certain limitations that might be challenging to overcome. The benefit is that upon logging in, you get a pre-configured environment, fully ready for conducting tests. This is an attractive solution, especially when you need to quickly generate small-scale load and easily analyze test results.
The other benefits of Cloud can be replaced with free alternatives. For example:
- For data visualization, you can use Grafana.
- For distributed testing, you can leverage the xk6-operator extension.
- As for automated quality gate, you can rely on keptn on built in thresholds.
Currently, K6 Cloud is a paid version, and costs might be a significant factor, particularly for startups. Furthermore, the generated maximum load has its limitations, which might not suffice for large-scale projects.

A tool that developers could love in the 21st century – what does it mean?
A tool that developers could love in the 21st century
With these words, k6 developers summarize their work on the tool. Let’s ponder this for a moment. To understand what exactly this means, let’s analyze two approaches that have evolved over the past few years.
First approach
The first approach involves moving away from traditional, somewhat primitive forms of performance testing. In this scenario, a company either hires a Performance Engineer on an ad-hoc basis or once every few months to prepare and execute scripts. The entire analysis and risk assessment rest with the Developers. This is a significant mistake, as application performance should be tested continuously with each deployment. Furthermore, maintaining test scenarios, CI/CD, and observability system analysis is a full-time job. This requires Performance Testers to possess specific skills and broad knowledge in many areas.
The described approach is known as “Performance Engineering.” Under this methodology, Sii has developed an innovative strategy for performance testing, known as Next Generation Performance Testing.
This approach adopts a flexible stance towards projects and development processes, automates the entire performance testing process, and provides an individualized approach tailored to the technologies used. This achievement was made possible through close collaboration with industry-leading performance testing leaders such as Tricentis, Dynatrace, and Microsoft.
Second approach
The second evolving approach over the years is Infrastructure as Code. It involves managing and delivering infrastructure using code rather than manual processes. This encompasses deploying new application versions as well as testing.
However, using traditional performance testing tools like JMeter doesn’t align well with this convention. Scripts in JMeter are written in XML format, making code review difficult and slowing down the script delivery process. In practice, scripts are not delivered as code since editing them requires a GUI, hindering the implementation of automated testing in CI/CD. Moreover, for larger teams, maintaining script consistency becomes a challenge after introducing multiple changes simultaneously.
To address these challenges, the k6 team has developed several innovative solutions, including:
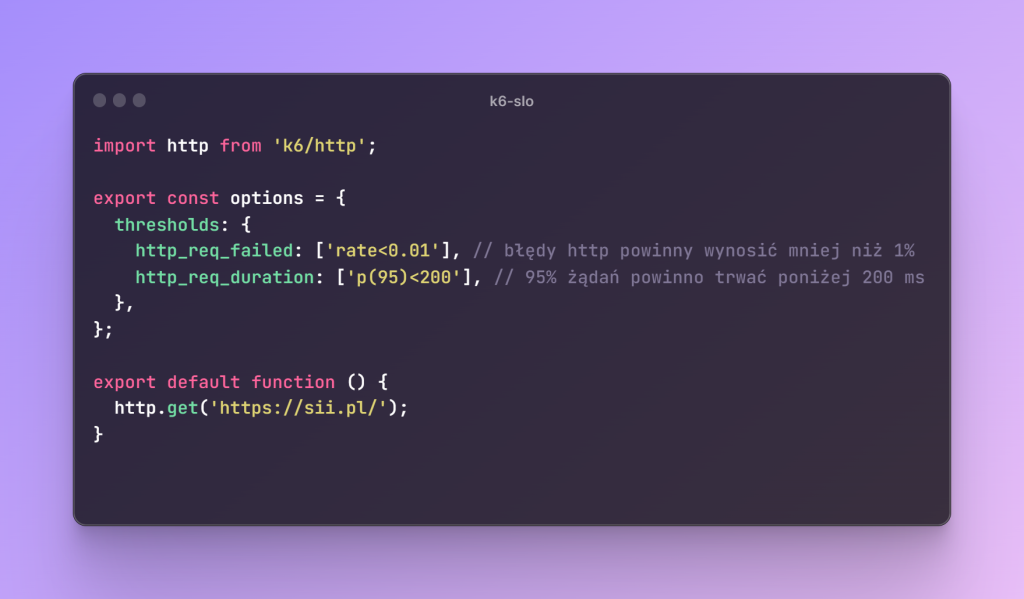
- The ability to add Service Level Objectives (SLOs) directly in the script.
- Integration with various system monitoring tools.
- Advanced integration options with CI/CD.

Development Prospects of the k6 Tool
An important aspect to consider when choosing a tool for a project is the support from the community and the development team behind the tool. Why is this crucial? There’s a risk that a project might be abandoned overnight (as seen in the case of Pylot) or new versions might cease to be released. Unfortunately, such situations often occur with open-source projects. This is why I’m more favorably inclined towards tools that are fully or partially paid. Examples include NeoLoad, NBomber, and Artillery, among others. However, I will focus on them in a separate article.
Grafana Labs
To understand the magnitude of the k6 project, we need to briefly review its history. It’s essential to note that k6 has been under the wing of Grafana Labs since June 2021. These are specialists in monitoring and observability systems. Their flagship tool is Grafana, responsible for data visualization. Other notable projects include Loki, Mimir, and Phlare.
In addition to these, Grafana Labs is also involved in the development of other open-source projects such as:
- Prometheus – for collecting and storing time series metrics.
- Cortex – scalable metric stores.
- Jaeger – distributed tracing.
These projects form part of a broader ecosystem of monitoring and data analysis tools, often used in conjunction with Grafana.
This leads me to believe that the involvement of such a significant player in the systems monitoring domain in the development of a performance testing tool is a wise decision that could bring revolutionary changes to the field of performance testing.
Development Direction
Another important aspect is the direction in which the tool itself is evolving. It doesn’t merely focus on measuring and analyzing application performance, but it has been expanded to include the capability of conducting functional tests and even Chaos tests. Initially, these were separate projects, but after months of trial and error, they were integrated into the core documentation of the k6 tool. This is significant as it introduces an interesting direction for the evolution of modern Quality Assurance (QA) testers and their traditional work.
The nature of performance testing and Chaos testing is moving towards full automation and integration with continuous integration practices in alignment with “shift left” practices. This is crucial as such a direction effectively broadens the competencies of performance testers to encompass knowledge in both DevOps and application architecture. At this juncture, QA ceases to be responsible solely for conducting tests in the final stages of application deployment and, instead, initiates automated analysis right from the early stages of development.
Love-Hate Relationship: Advantages and Disadvantages of k6
k6 boasts several advantages, such as:
- A low entry barrier.
- The ability to integrate with various third-party services.
- Support from the community and an experienced developer team.
Moreover, by using the JavaScript language for scripting, k6 ensures ease of understanding and enables the creation of a user-friendly framework for performance testing applications. Additionally, the use of Go language as the foundation for k6 translates to high performance, enabling tests to be conducted under heavy load even with limited resources.
However, like any tool, k6 also has its drawbacks.
One drawback I’ve encountered is the instability of some community-contributed extensions. It’s understandable that the development team cannot provide full support for every protocol or integration of k6 with less popular tools. This can lead to instability and a high degree of unreliability in certain extensions. Furthermore, if you decide to simultaneously use multiple extensions, there’s a high likelihood of incompatibility due to the underlying libraries used (both k6 and its extensions are written in the Go language).
Another drawback is the lack of support for lesser-known protocols. Despite the significant interest from the k6 community, it is relatively new compared to alternatives such as JMeter, Locust, or NeoLoad. Opting for less mature software might hinder framework expansion, integrations, and, in extreme cases, necessitate changing tools and refactoring tests. Personally, I believe that k6 excels in the context of simple projects or those primarily based on the HTTP protocol. However, when it comes to replacing tools like Playwright (for functional testing) or LitmusChaos (for Chaos testing) with k6, it might be necessary to wait a few more months, or even years.
Alternatives?
We’ve discussed the entire methodology and vision behind the k6 tool. We know its development prospects and its capabilities and limitations. It’s challenging to find alternatives on the market that align with current trends. Moreover, very few tools are stable enough to meet the requirements of both large corporations and small startups. Therefore, the search for the ideal tool should focus on reliability and limitless usability. So where can we find this “Holy Grail”?
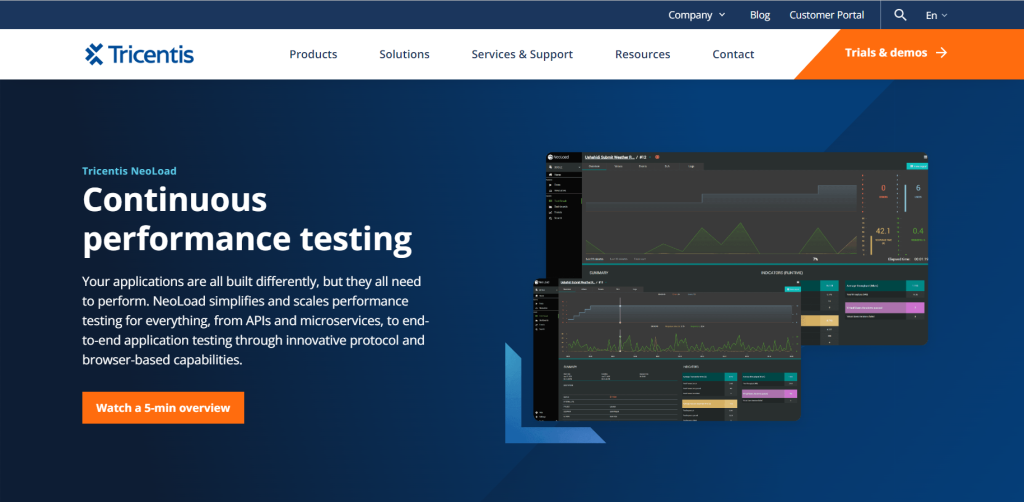
One option is NeoLoad by Tricentis. Since it’s not an open-source tool, we can avoid situations where we encounter instability or a lack of support for protocols used in modern projects. Furthermore, it’s commendable that NeoLoad has been continuously developed since 2005, and its design allows experienced engineers to migrate from widely used JMeter in just one day.
For many clients, migrating to NeoLoad has proven to be a highly beneficial investment that brings benefits such as faster and easier test execution and significantly lower script maintenance efforts in the long run.

Conclusion
k6 outperforms all other tools available on the market that rely on delivering tests as code (such as JMeter, Artillery, or Gatling). Strong community support places k6 in a prominent position, surpassing both Locust and Gatling. Furthermore, the availability of a wide range of extensions allows for a flexible and personalized approach to projects. Currently, there are over 73 extensions available on the k6 website. For comparison, JMeter has 107. This demonstrates the interest and engagement of the community in supporting k6’s development.
In addition, the close collaboration with Grafana Labs has significantly contributed to the tool’s development in various testing areas. This, in turn, has led to the promotion of Performance Engineering, directly supported by the experts from the Sii team.
What does the future hold?
In today’s times, the scope of competencies for a performance engineer continues to broaden. Therefore, to meet this challenge, it’s not only essential to choose the right tool but also to develop a methodology that fulfills current project requirements. Manually running tests and repeatedly analyzing the same data becomes outdated in favor of full automation, testing software in the early project phases, and delivering everything as code.
We cannot predict the exact changes that the future will bring, but one thing is certain – the evolving new approaches in the field of performance testing will be revolutionary and will turn this area upside down.
k6 aligns well with the concept described above due to its delivery of tests as code and the design of test scenarios with multiple executions in mind. All of this is complemented by fully automated result analysis and close collaboration with Grafana Labs.
Sources
***
You can also learn more about k6 in other articles by our experts.


Leave a comment