The development of applications in recent years is undeniable. Applications have become more advanced and complex, offering users more features and interactions. However, the increasing complexity of applications brings new challenges that require innovative solutions, such as Continuous Integration/Continuous Deployment (CI/CD).
To implement them, it is necessary to use tools tailored to our times. One such tool is k6, which introduces capabilities not present in other performance testing tools.
Metrics
In k6, metrics are numerical values or statistics that help analyze and monitor the performance of applications and the behavior of test scenarios. K6 offers two types of metrics – built-in metrics and user-defined metrics.
All metrics have one of the four available types:
- Counters – summing up data values (e.g., the number of detected errors),
- Gauges – minimum, maximum, and latest values (e.g., the number of users used in the test),
- Rates – frequency of non-zero values (e.g., the number of successful assertions),
- Trends – statistics for multiple values, such as average times, percentiles, medians, or average response times (e.g., server response times).
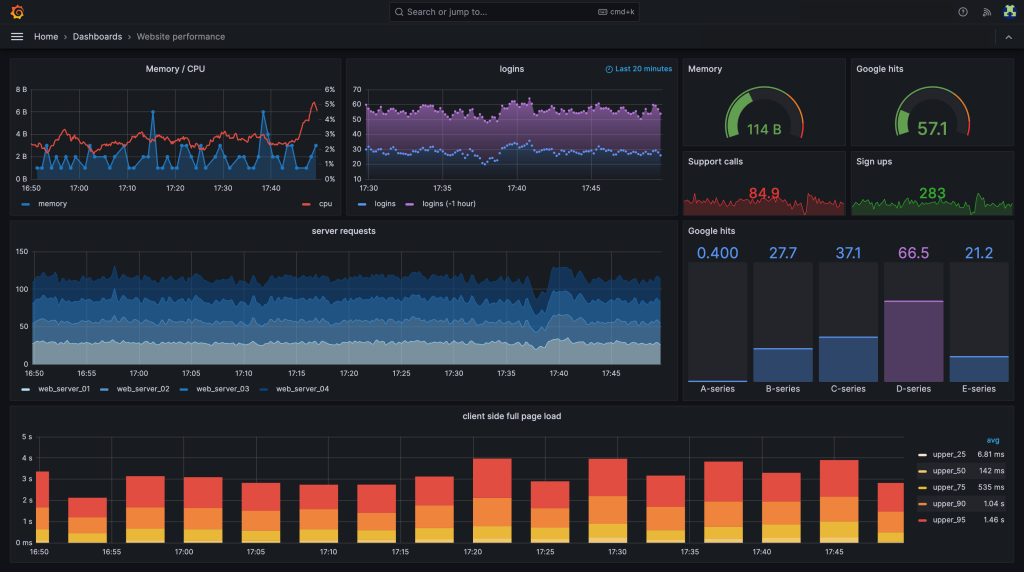
These metrics are useful not only for summaries but also for visualization using external tools like Grafana.
To define custom metrics, you need to create an instance of the appropriate class and then add sample values to it.
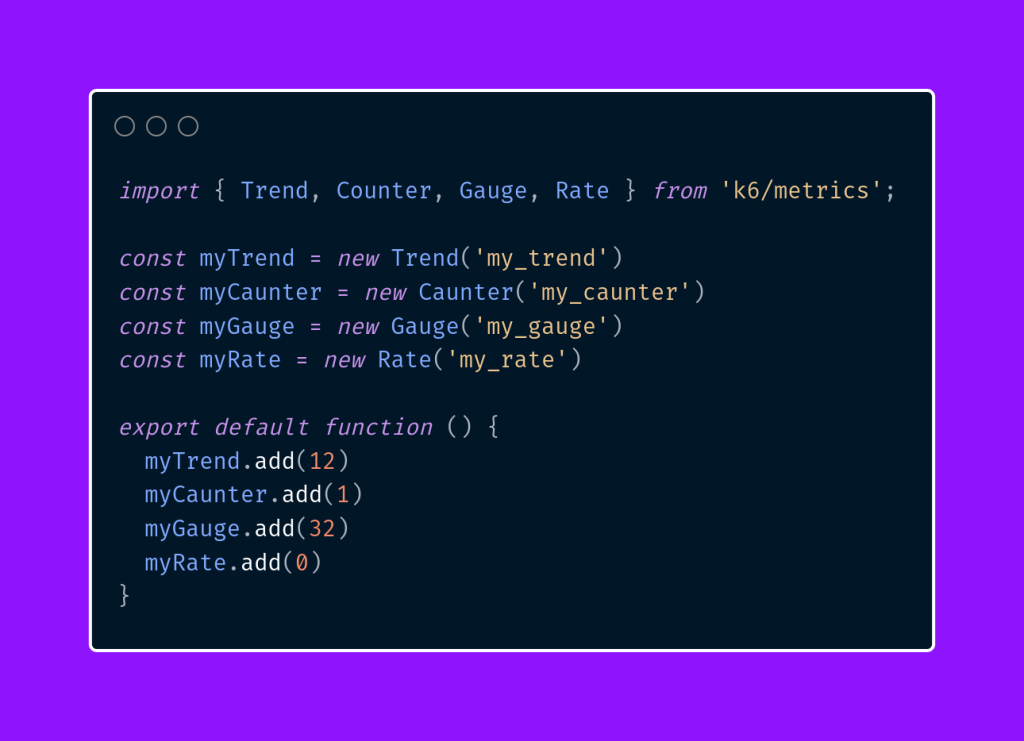
During the test execution, we can operate on metrics or send them to databases such as InfluxDB in real time.
Tagging
K6 has a tagging feature that allows assigning labels or categories to specific elements of the test scenario. Tagging helps categorize individual test elements, making it easier to filter results. Tags are a powerful and flexible mechanism that automatically adds metrics to the relevant elements. Let’s take a simple example of an HTTP request to illustrate this mechanism.
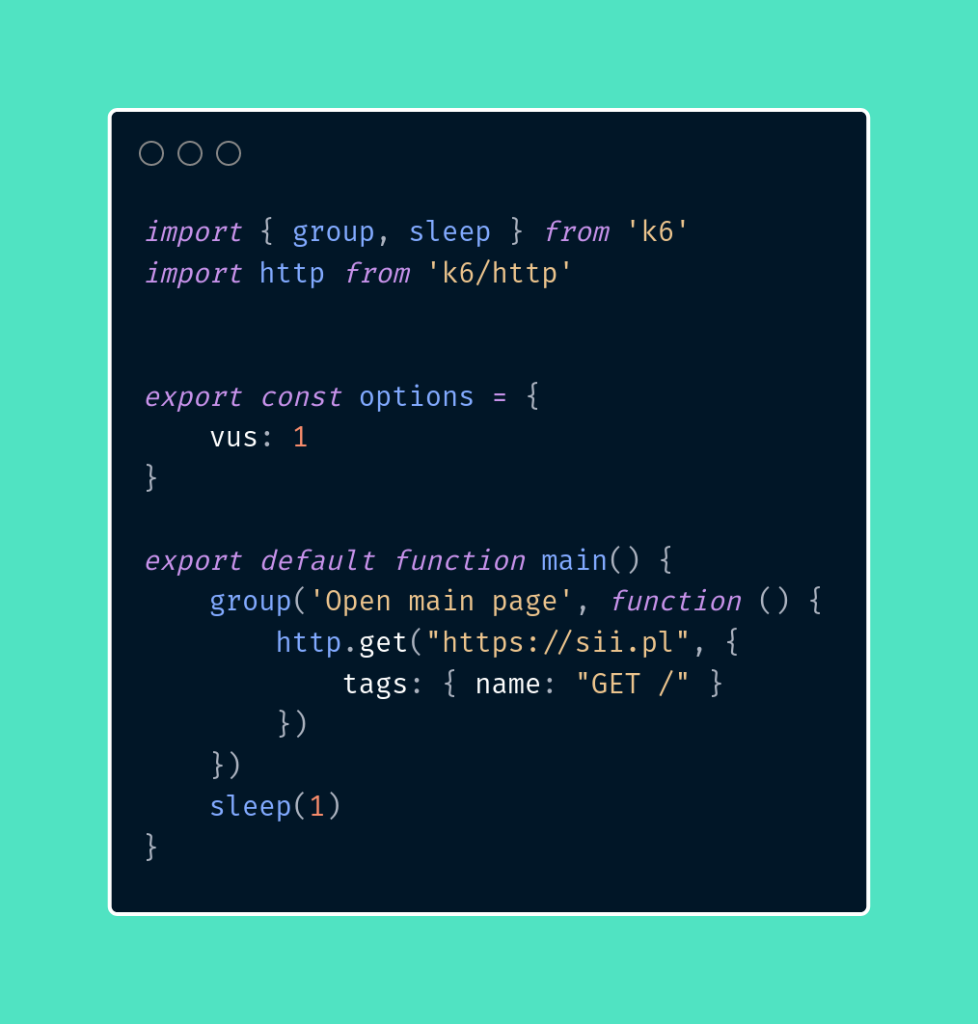
In the above example, we defined a tag named name with the value GET / for the homepage request. As a result, a Trend type metric will be automatically created, storing data related to server response times, minimum and maximum values, median, and percentiles.
Based on tags, we can easily filter the collected data and perform advanced operations on it.
Not all tagged data is automatically visible in the test summary. In the open-source version of k6, the only way to display them is by defining appropriate quality gates.
What are Quality Gates?
Quality Gates are checkpoints or criteria that must be met by software during the delivery process to allow its continuation to the next phase. They are used in Continuous Delivery and Continuous Deployment as an automated quality control mechanism in the software development lifecycle.
During the software delivery process, various stages such as build, testing, deployment, and delivery need to be monitored, and the software’s quality must be constantly checked. Quality Gates are a set of predefined criteria that determine whether a given stage or version of the software is ready to move to the next stage or environment. If any of the conditions are not met, the process can be stopped, and the issue must be fixed before attempting to continue.
In the context of performance testing, quality gates will be used to establish the acceptable values of metrics. These may include server response times, the number of detected errors in the application, or the amount of transmitted data. As we discussed earlier, some of the tags are visible in the test summary.
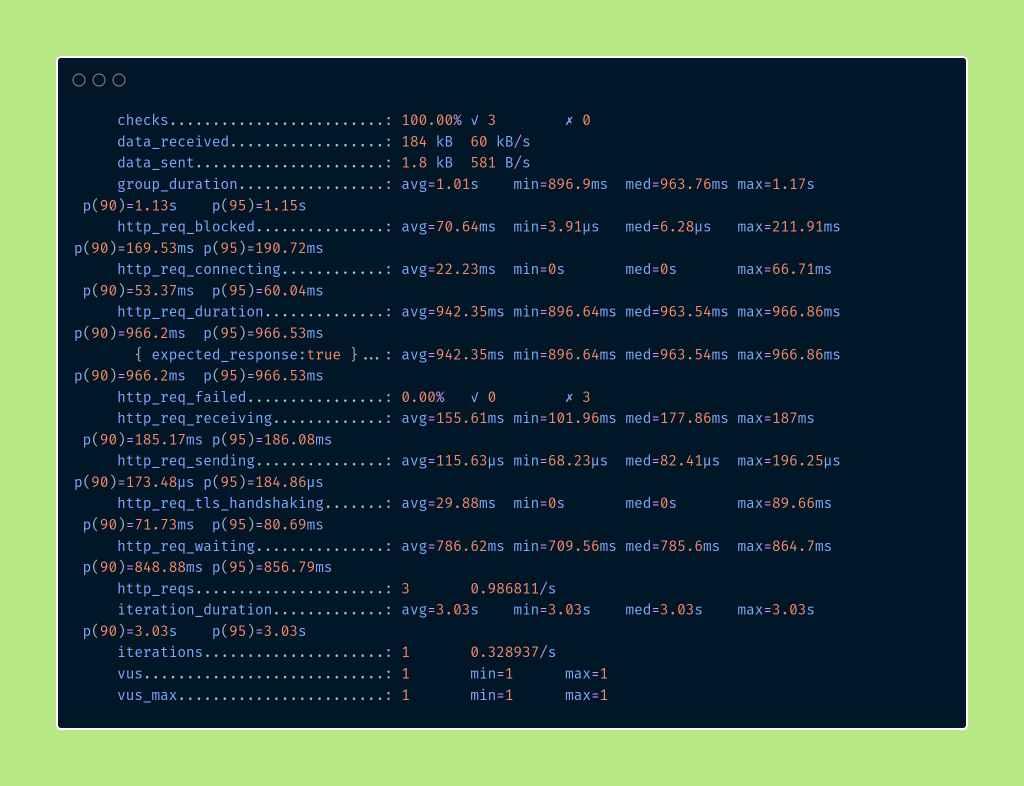
These metrics are a general way of assessing the application’s performance. In k6, quality gates are defined using the options object. Let’s create a simple scenario based on which we can visualize the quality gates.
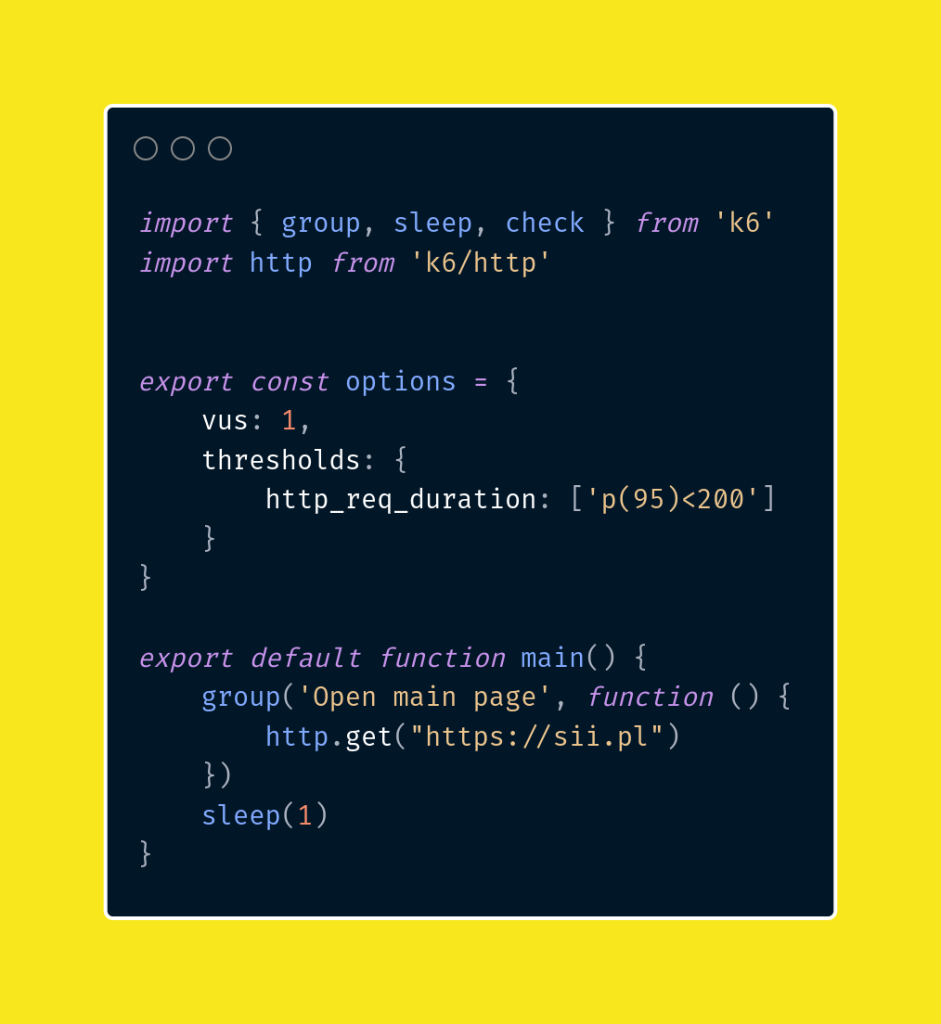
In the above example, we assumed that 95% of response times for all requests should be below 200 ms. If the response time exceeds this limit, the test will be considered unsuccessful. The syntax for quality gates is as follows:
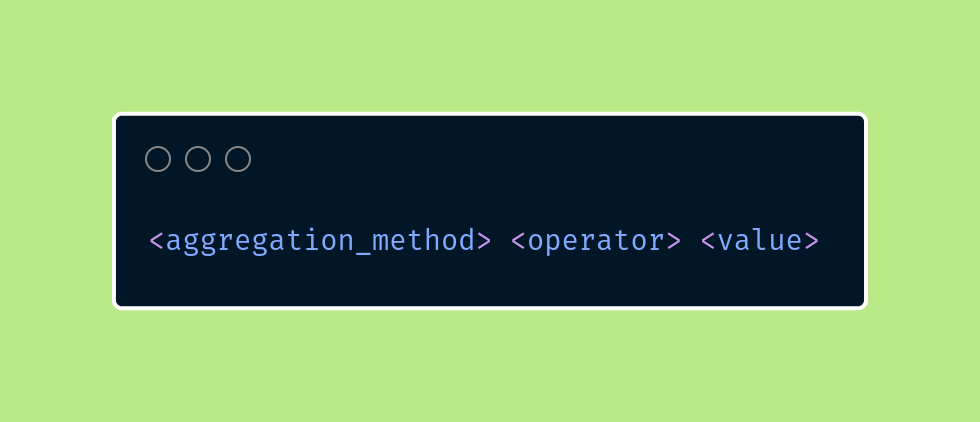
As mentioned earlier, metrics have different types, which means that the aggregation method will be different for each type. Below is a list of available metric types along with possible aggregations:
| Metric | Aggregation Method |
| Counter | count, rate |
| Gauge | value |
| Rate | rate |
| Trend | avg, min, max, med i p(N), gdzie N jest przedziałem z zakresu od 0.0 do 100, na przykład p(43.12). Dane te są w milisekundach |
Additionally, one metric can have several different thresholds.
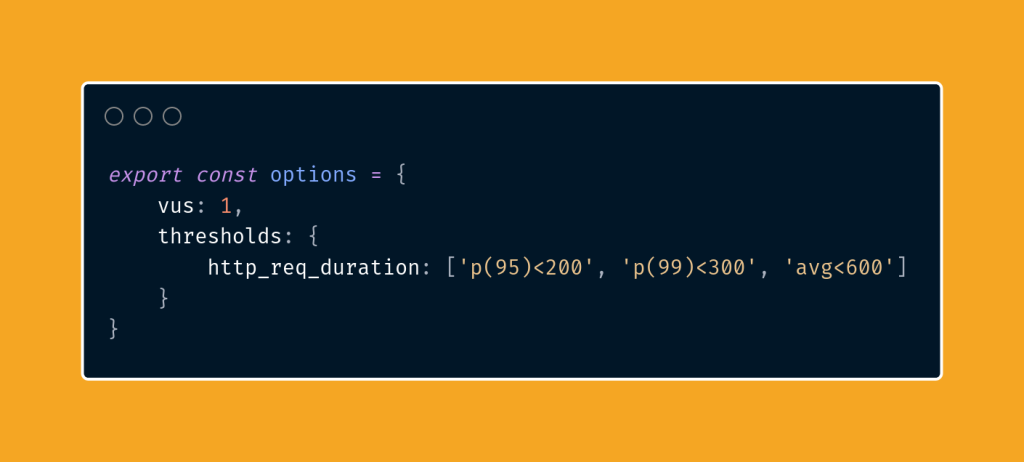
Additionally, k6 offers the ability to stop the test’s execution if a metric is deemed unacceptable.
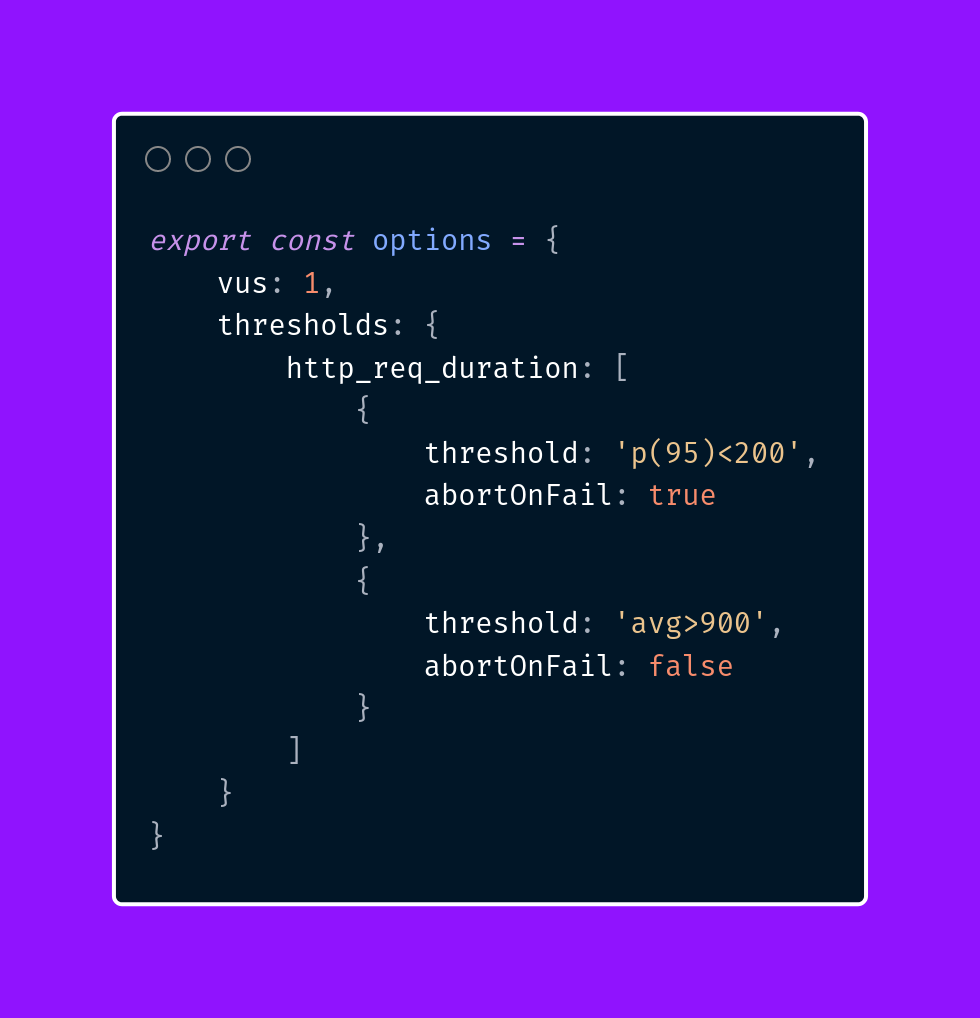
Let’s go back to tagging for a moment. As mentioned earlier, tags are not visible in the basic summary. Let’s now try to create a quality threshold for HTTP request times marked with the tag name and the value GET /.
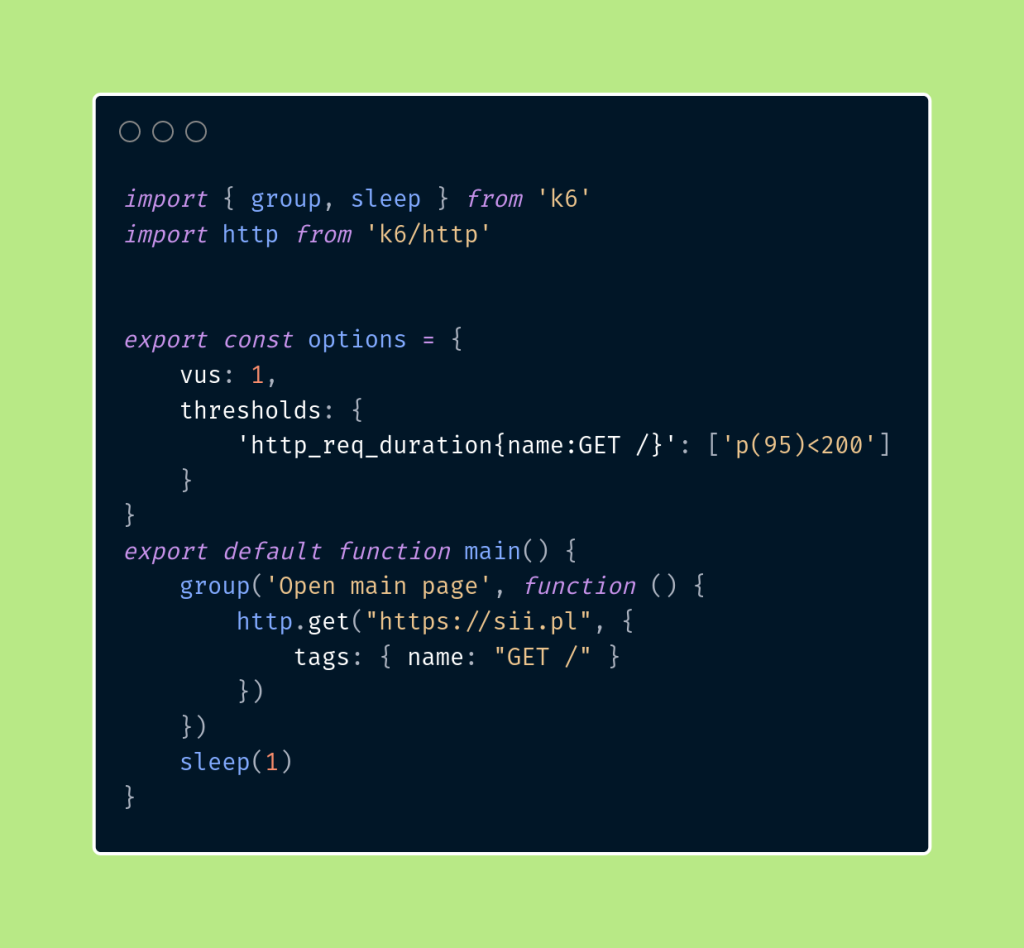
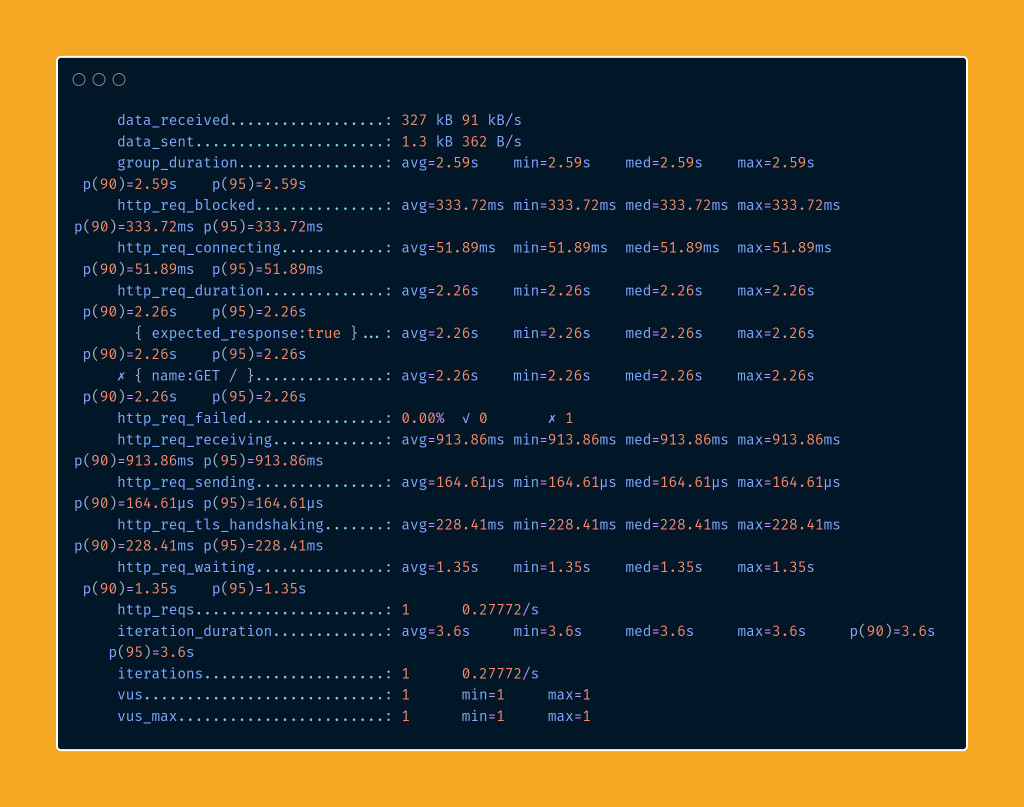
This way, after running the test, we will be able to see that our tagged request has been included in the summary.
Summary
In today’s third part of the series, we discussed different types of metrics and tagging in k6. Additionally, we learned what quality gates are and how to apply them in tests. In our next post, we will focus on executor types and scenario models.
If you haven’t had a chance to read the articles in the series yet, you can find them here:


Leave a comment